Important note: In this document the notation v is used to denote the vibrational quantum number, and ![]() to denote the transition frequencies. To help distinguish between them, they will be marked red and blue from now on.
to denote the transition frequencies. To help distinguish between them, they will be marked red and blue from now on.
Introduction
Spectroscopy is the analysis of absorption or emission of electromagnetic radiation by an analyte. An electromagnetic spectrum is achieved by splitting the electromagnetic radiation to numerous wavelength components and measuring the intensity of radiation from each component. This data is colleted and presented as a plot of intensity as a function of frequency or wavelength. Spectroscopy can be used to determine structure, symmetry and energy levels, among other molecular features.
Electronic spectroscopy of small molecules provides chemists with the fundamental understanding of the nature of the chemical bond in quantum mechanical detail. A chemical bond is not infinitely strong but has a well-defined bond energy. The frequency of vibration of the nuclei attached by a chemical bond is determined by how stretchy or stiff the bond is. The bond has a length, which is characterized by the vibrationally averaged position of the atoms at either end of the bond. To a good approximation, these and all other properties of the bond between atoms can be derived from the potential energy curve.
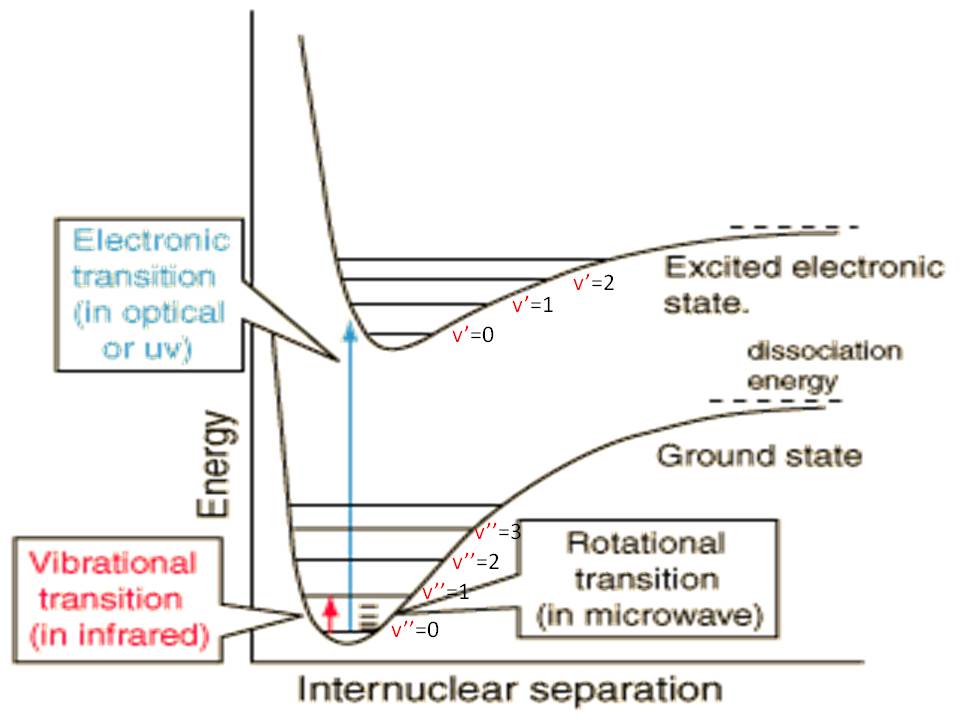
The total energy of a diatomic molecule can be separated into translational energy and internal energy. We are concerned here with the internal energy Eint which is comprised of electronic, vibrational and rotational energies. The electronic energy refers to the familiar electronic state of the molecule. The vibrational energy can be understood if you think of the chemical bond as a spring that vibrates around its equilibrium point. The vibrational energy of the molecule is the spring's energy. The rotational energy is related to the way the molecule as a whole rotates. All these energies are quantized. The rotation and vibration of a molecule is demonstrated in Figure 1, and more examples can be found here.
Eint can be expressed to a good approximation by:
where Eel is the electronic energy, Evib is the vibrational energy, and Erot is the rotational energy. The electronic energy Eel refers to the minimum value of the potential curve for a given electronic state. The zero of energy is arbitrarily taken as the minimum in the potential curve (Morse Potential) for the lowest electronic state (ground state). The electronic, vibrational and rotational energy curves are shown in Figure 2. The energy differences between rotational states are much smaller than those between vibrational states, and the energy differences between vibrational states are much smaller than differences between electronic states. This means that many vibrational states "belong" to the same electronic state, and that many rotational states "belong" to the same vibrational states. As the vibrational or rotational energy increases, the difference between adjacent levels decreases, until the levels are no longer discrete, but approach the classic limit.
It is convenient to divide equation (1) by the quantity hc [J•cm], where h is Planck's constant and c is the speed of light, expressed in units of cm/sec, to get the so-called term value, which has units of cm-1. Thus:
In this equation, the electronic, vibrational and rotational term values, Eel/hc, Evib/hc and Erot/hc, are given their conventional symbols Tel, G and F, respectively. The advantage of this change is a quick and straightforward conversion between a measured spectrum units and a unit proportional to the energy scale that is of interest. Thus, the wavenumber for a transition between two electronic states can be simply expressed by:
Where primed (') parameters are properties of the higher energy level, and the double-primed (") parameters are of the lower energy level. Later on we will use X and B to define the relevant energy levels.
The Boltzmann Distribution
In systems of identical particles with defined energy levels, the Boltzmann distribution describes the probability (P) of finding a particle at a specified energy (E). The Boltzmann distribution is given by:
where,
Z is the normalization constant (called the partition function), k is the Boltzmann constant and T is the temperature. gi is the degeneration of the energy level (not relevant in our case) and i is the associated quantum number of the energy level Ei.
As a useful example, consider that in the lower vibrational levels the potential curve can be approximated to a harmonic oscillator's curve. We would like to know the temperature at which we should conduct our experiment if we are interested in the transition originating from the mth vibrational level.
According to quantum mechanics, the energy levels of a harmonic oscillator are equally spaced and satisfy:
The partition function for such an oscillator is given by:
here
And so, the probability of finding a molecule at the m vibrational level is:
Transitions
Transitions between energy levels can be radiative or non-radiative. In this experiment, we will focus on a radiative transition, involving absorption or emission of electromagnetic radiation: When a photon is absorbed, its energy excites the molecule to a higher state, and when the molecule decays to a lower state, a photon is emitted. This latter photon does not necessarily have the same energy as the initial photon.
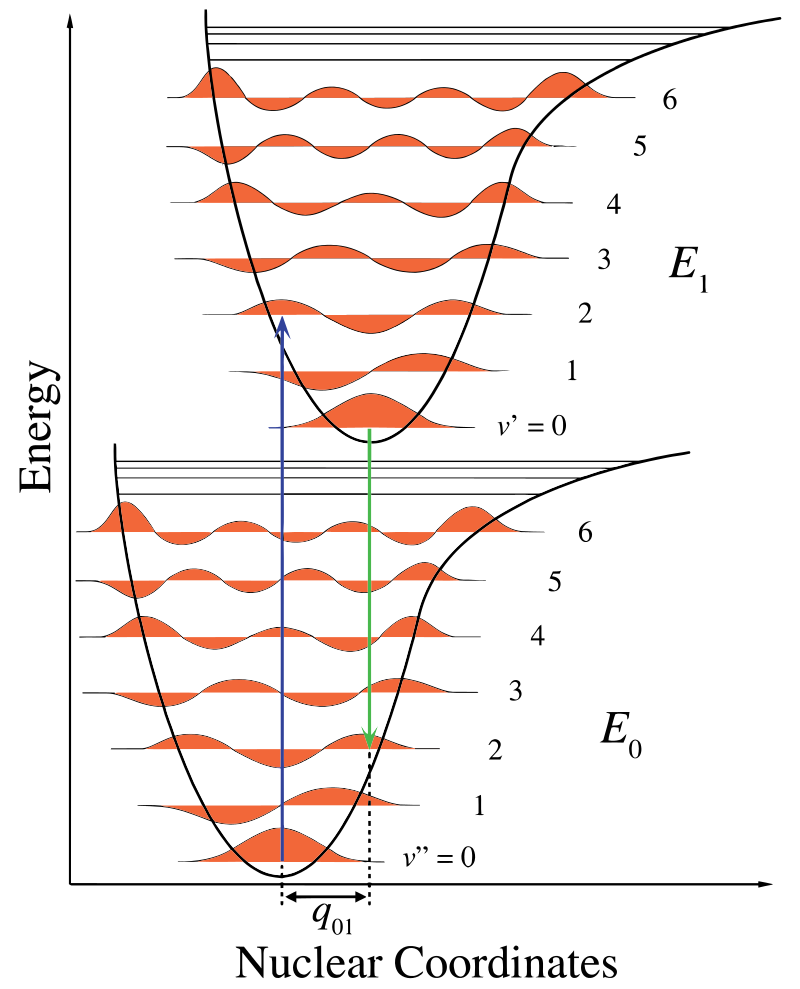
A transition sometimes involves more than one kind of molecular state (e.g, a change of both the electronic state and the vibrational state). In this case, there will usually be a difference between the absorbed and emitted photon energies, as shown in Figure 3.
- If the molecule decays back to the same state it originated from, the emitted and absorbed photons have the same frequency (and energy). This is Rayleigh scattering.
- If the molecule decays to a state of higher energy than the one it originated from, the emitted photon has a lower frequency than the absorbed photon. This is a Stokes shift.
- If the molecule decays to a state of lower energy than the one it originated from, the emitted photon has a higher frequency than the absorbed photon. This is an anti-Stokes shift.
Vibration spectrum - absorption spectroscopy
In vibrational absorption spectroscopy experiment, the rotational term difference (F' − F") in equation (3) may be ignored, since rotational structure is not resolved in this experiment. Although most of the I2 molecules occupy the ground vibrational level, they occupy various rotational levels. At room temperature, a collective of transitions originating from many rotational levels will broaden the line width of the measured spectrum beyond the energy spacing between adjacent rotational states.
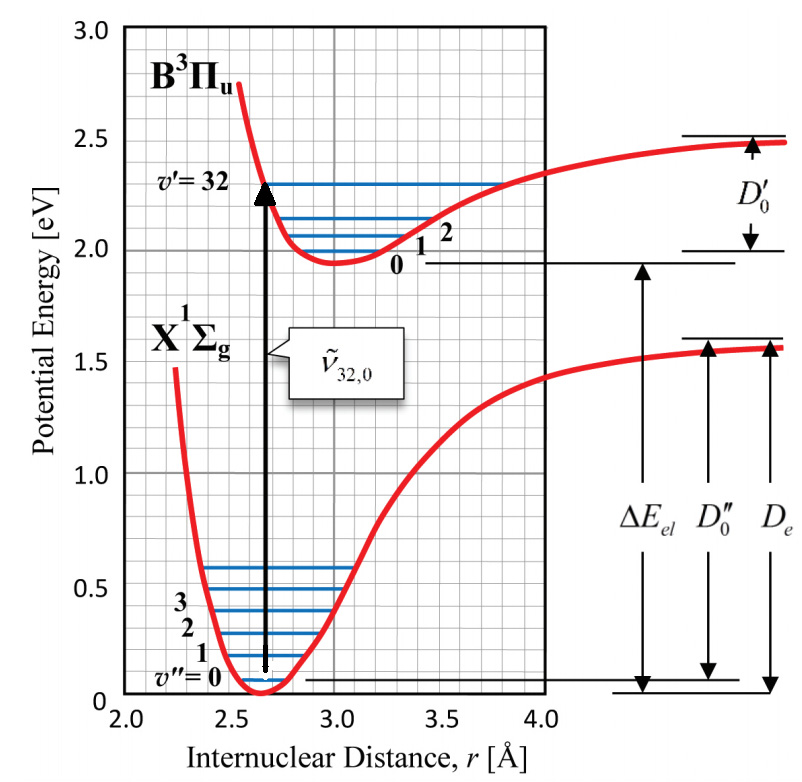
The transitions that give rise to the absorption spectrum take place between the ground electronic state of the iodine molecule and an excited electronic state. At room temperature, all iodine molecules are in the ground electronic state, and nearly all are in the ground vibrational state (v" = 0) as well. For this reason, most of the transitions in the absorption spectrum of iodine originate in the state v" = 0. Since the vibrational frequency of iodine is not high, the transitions in the absorption spectrum are observed not only from v" = 0, but also from v" = 1 and v" = 2 (take a look at the Experimental Procedure to see how this affects the data). Figure 4 illustrates how the absorption transitions begin in the state v" = 0 and terminate in the upper electronic state in all possible vibrational states, where v' ranges from 0 to infinity. Since only a single vibrational state is involved in the lower electronic state, the spectrum is simpler than the emission spectrum that arises from transitions between all possible vibrational levels in both electronic states.
 is used instead of ω.
Figure 4 exemplifies the transition from the \( \nu''=0 \) level on the \( X \) electronic potential to \( \nu'=32 \) on the \( B \) electronic potential of molecular iodine (\(\mathrm{I_2}\)). Such a transition manifests as an absorption line in the spectrum. The Born–Oppenheimer (BO) approximation relies on the large difference in time scales of electrons versus nuclei: electrons redistribute much faster than nuclei (due to their mass difference). Under BO, the transition is effectively vertical (as depicted by the black arrow in Fig. 4), i.e., the internuclear distance is taken as frozen during the electronic transition (\(X \rightarrow B\) in our example). In this framework, the transition energy is the sum of the electronic and vibrational energies (see Eq. 3). This energy corresponds directly to the absorption line frequency (or wavelength) measured in the experiment.
The electronic transition is driven by the interaction of the transition dipole operator \( \boldsymbol{\mu} = q \,\mathbf{r} \) with the electric field of the light. The transition probability is proportional to the squared transition dipole matrix element:
Since the nuclei are considered “frozen”, the total wavefunction can be written as a product of nuclear and electronic parts:
In evaluating the transition matrix element, the nuclear overlap factors out as a prefactor (the operator \( \boldsymbol{\mu} \) acts on the electronic coordinates):
This is precisely the content of the Franck–Condon principle: the probability (and intensity) of a particular vibronic transition is dictated by the overlap between the initial and final nuclear wavefunctions (the Franck–Condon factor), together with the electronic transition dipole.
It might be helpful to notice again that primed (') parameters are properties of the upper state only, whereas the double-primed (") parameters are lower state properties. Values with no prime at all correspond to photon wavenumbers that result from transitions between states. It is customary to use the wave number (cm-1) as a unit of "energy" for both states and transitions between them. With this nomenclature in mind the upper G'(v') and lower G"(v") state energies are written as:
Note that T"el = 0 for the ground state. The absorption transition between these sets of energy levels is then given by:
When v" is equal to zero, equation (12) becomes an expression for the absorption spectrum (we ignore here the second order anharmonicity constant ![]() )
)
This equation holds true for all possible transitions between v" = 0 and any v'. As already pointed out, not all of these transitions may be sufficiently intense to be observable.
The Birge-Sponer Extrapolation
Of special interest are the spacings between the vibrational energy levels. By examining the transitions illustrated in Figure 4, it is clear that one can extract information about the energy level spacing from the absorption spectrum. For example, in the B state, the spacing ![]() between the v' = 0 state and the v' = 1 is given by G'(1) − G'(0). In general the spacing can be obtained from equations (10) - (12). Choosing v" = 0 and ignoring the second order anharmonicity constant
between the v' = 0 state and the v' = 1 is given by G'(1) − G'(0). In general the spacing can be obtained from equations (10) - (12). Choosing v" = 0 and ignoring the second order anharmonicity constant ![]() , the spacing is:
, the spacing is:
Here v' is the upper-state vibrational quantum number of the lower energy member of the pair, and ![]() is the vibrational energy level spacings (i.e., difference in energy) in the B electronic state. The values of
is the vibrational energy level spacings (i.e., difference in energy) in the B electronic state. The values of ![]() are experimentally accessible, since they are just the differences in energy (cm-1) between adjacent pairs of absorption bands.
are experimentally accessible, since they are just the differences in energy (cm-1) between adjacent pairs of absorption bands.
Equation (14) is the equation of the linear Birge-Sponer extrapolation. It shows that the spacings are a linear function of the vibrational quantum number. If ![]() is plotted against (v' + 1), the result is a straight line, the slope of which equals
is plotted against (v' + 1), the result is a straight line, the slope of which equals ![]() and the intercept of which equals
and the intercept of which equals ![]() . The plot is called a Birge-Sponer extrapolation. The plot is linear if second-order anharmonicity constants are sufficiently small (Figure 6a), and they often are. The plot deviates from the linear trend when the anharmonicity constants are not negligible (Figure 6b).
. The plot is called a Birge-Sponer extrapolation. The plot is linear if second-order anharmonicity constants are sufficiently small (Figure 6a), and they often are. The plot deviates from the linear trend when the anharmonicity constants are not negligible (Figure 6b).
The dissociation energies D'0 and D'e can be also determined from the Birge-Sponer extrapolation. Comparing D'0 with the spacings between the upper-state vibrational energy levels in Figure 4, it is apparent that D'0 is exactly equal to the sum of all the spacings. Since many spacings fall between the state v" = 0 and the convergence limit at v'→∞, you can replace the summation sign with an integral:
This area is the total area of the triangle in Figure 6a. Even if the Birge-Sponer extrapolation is nonlinear, as it is when the higher anharmonicity constants are not negligible, the area under the curve can still be measured, for example by Simpson's method to yield D'0.
Thus, from the absorption spectrum, the upper-state parameters, ![]() ,
, ![]() , and D'0 can be determined. Further, examination of Figure 4 reveals that the difference between D'0 and D'e is just ½
, and D'0 can be determined. Further, examination of Figure 4 reveals that the difference between D'0 and D'e is just ½![]() , the zero point energy. Consequently, D'e can also be extracted from the absorption spectrum.
, the zero point energy. Consequently, D'e can also be extracted from the absorption spectrum.
The Convergence Limit
Because the intensities of the absorption transitions fall off at high upper state quantum numbers, it is not possible to observe the convergence limit directly in the iodine spectrum. Figure 6 reveals that:
where E* is the convergence limit, ![]() is the energy of the absorbed photon at which the extrapolation began (in cm-1) and A' is the area under the Birge-Sponer curve from v'b (the vibrational quantum number corresponding to
is the energy of the absorbed photon at which the extrapolation began (in cm-1) and A' is the area under the Birge-Sponer curve from v'b (the vibrational quantum number corresponding to ![]() ) to v'c (the vibrational quantum number at convergence). The shaded area in Figure 6a equals A', and the total area under the curve (shaded and unshaded areas) equals D'0, the upper-state dissociation energy.
) to v'c (the vibrational quantum number at convergence). The shaded area in Figure 6a equals A', and the total area under the curve (shaded and unshaded areas) equals D'0, the upper-state dissociation energy.
Rotation Spectrum - Laser-Induced Fluorescence
In this section we will discuss a Laser Induced spectroscopy (LIF) experiment. When we considered the absorption spectrum in the previous section, the rotational energy contribution, F' − F", was neglected. Now we need to consider contributions of the rotational levels, F'(J') − F"(J"), to each vibrational (v" − v') transition.
The rotational energy of rigid rotor Erot is given by:
where J is the rotational quantum number and I =μRe2 is the moment of inertia. Here μ is the reduced mass of the iodine molecule and Re is the equilibrium distance between atoms. We define B as the rotational constant:
Equation (17) can be written in term values as:
When considering a rotational transition, the following selection rule is valid for electronic transitions in the iodine molecule:
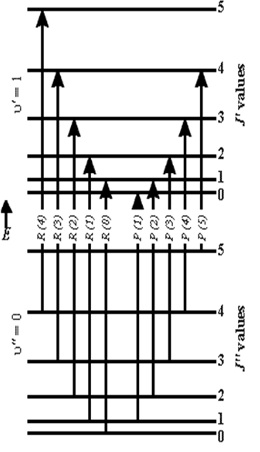
This selection rule can be understood based on the angular momentum conservation law. Since a photon has one unit of angular momentum, the angular momentum of a molecule must change by a compensating amount after emission or absorption of a photon. Thus we expect that for each electronic or vibrational transition, there will be two end levels as shown in Figure 7:
- One corresponding to F'(J + 1) − F"(J), known as the R branch.
- A second corresponding to F'(J − 1) − F"(J), known as the P branch.
The rotational energy, F(J), is relatively small, especially for molecules with a large moment of inertia (small B), and therefore many rotational levels are populated at room temperature. The number of transitions is twice the number of populated levels, and we cannot resolve these lines in an absorption experiment. A monochromatic laser, however, will excite only one or several rotational transitions, so that the transitions can be resolved. Two different rotational/vibrational electronic absorption transitions can be excited by He-Ne laser radiation:
- P(33)6←3: v"=3, J"=33 of the ground state, X → v'=6, J'=32 of the B electronic state
- R(127)11←5: v"=5, J"=127 of the ground state, X → v'=11, J'=128 of the B electronic state
After excitation of the v' = 6, J' = 32 and v'=11,J' = 128 energy levels of the B state, the electronically excited molecules fluoresce back to the ground electronic state. The fluorescence rigorously obeys the ΔJ =±1 rotational selection rule, but the initially excited states can radiate to any vibrational level of the ground states. (Think about how this will allow us to study the energy spectrum of the iodine molecule?) The relative intensity of the fluorescence signals terminating on different v" levels are determined by Franck-Condon factors.
For each fluorescence transition from the excited v',J' level two transitions are possible to the v" level: One with J" = J' + 1 and other with J" = J' − 1. The difference in the wavenumber for these two transitions is:
Let us consider a specific case: In the case of R(127)11←5 branch, the laser excites the iodine molecules from (v"=5,J"=127) state to (v'=11,J'=128). Observing only Rayleigh scattering, the excited electrons have two possible relaxation paths. An excited electron can decay either to (v"=5,J"=127) level (ΔJ=-1, P Branch) or to (v"=5,J"=129) level (ΔJ=+1, R Branch). Therefore, the observed signal will be a doublet peak, split by ![]() = 514B". Thus, these two transitions can be easily resolved and the rotational constant (and therefore the bond length) can be measured. Similarly, for the case of P(33)6←3 branch:
= 514B". Thus, these two transitions can be easily resolved and the rotational constant (and therefore the bond length) can be measured. Similarly, for the case of P(33)6←3 branch: ![]() = 130B". In this case, the experimental resolution is not sufficient for detection of these two seperate transitions and the observed peak will be a singlet. Read the following paragraph for better prediction of the experimental resolution of this setup.
= 130B". In this case, the experimental resolution is not sufficient for detection of these two seperate transitions and the observed peak will be a singlet. Read the following paragraph for better prediction of the experimental resolution of this setup.
Resolving the Splitting
In order to verify that the measurement equipment is able to resolve this rotational splitting it is necessary to translate the result to wavelength space and compare it with a calculation of the resolving power of our monochromator based on the known components and setup.
Assuming a center wavelength of
This should be compared to the best resolution achievable by the monochromator (assuming here a Littrow configuration).
The reciprocal linear dispersion is provided by the manufacturer and w is the monochromator entrance slit width. For more details on the derivation of this expression and the monochrmator specs please see last semester's Experiment 1, "Spectrum of the Hydrogen atom" experiment. You should also read about other resolution-related phenomena, such as spectral line-widths, which are relevant in our experiment, calculate the typical magnitude of their broadening, and compare it with the calculation made above for the monochromator.
A Source for Comparison
You may use the following paper which describes studies of the iodine molecule and calculates the same parameters that we will.
McNaught I., "The Electronic Spectrum of Iodine Revisited"J. Chem. Educ., 1980, 57 (2), p 101.