Absorption Spectroscopy
In this part of the experiment, you will study the vibrational structure of the iodine molecule by measuring its absorption spectrum.- Calibrate the monochromator using a known emission spectrum (hydrogen or mercury).
- Assemble the setup of the lamp and two lenses. Align your setup so that 500 μm slits produce an intensity of 1000.
- Insert the iodine chamber.
- Measure the absorption spectrum of the iodine gas with the highest resolution possible. Use a wavelength range from 500 nm to 600 nm. Measure the spectrum at intervals of 5°C from room temperature to 40°C.
- Analyze your results. Tabulate the experimental values of the absorption maxima in nm and cm-1.
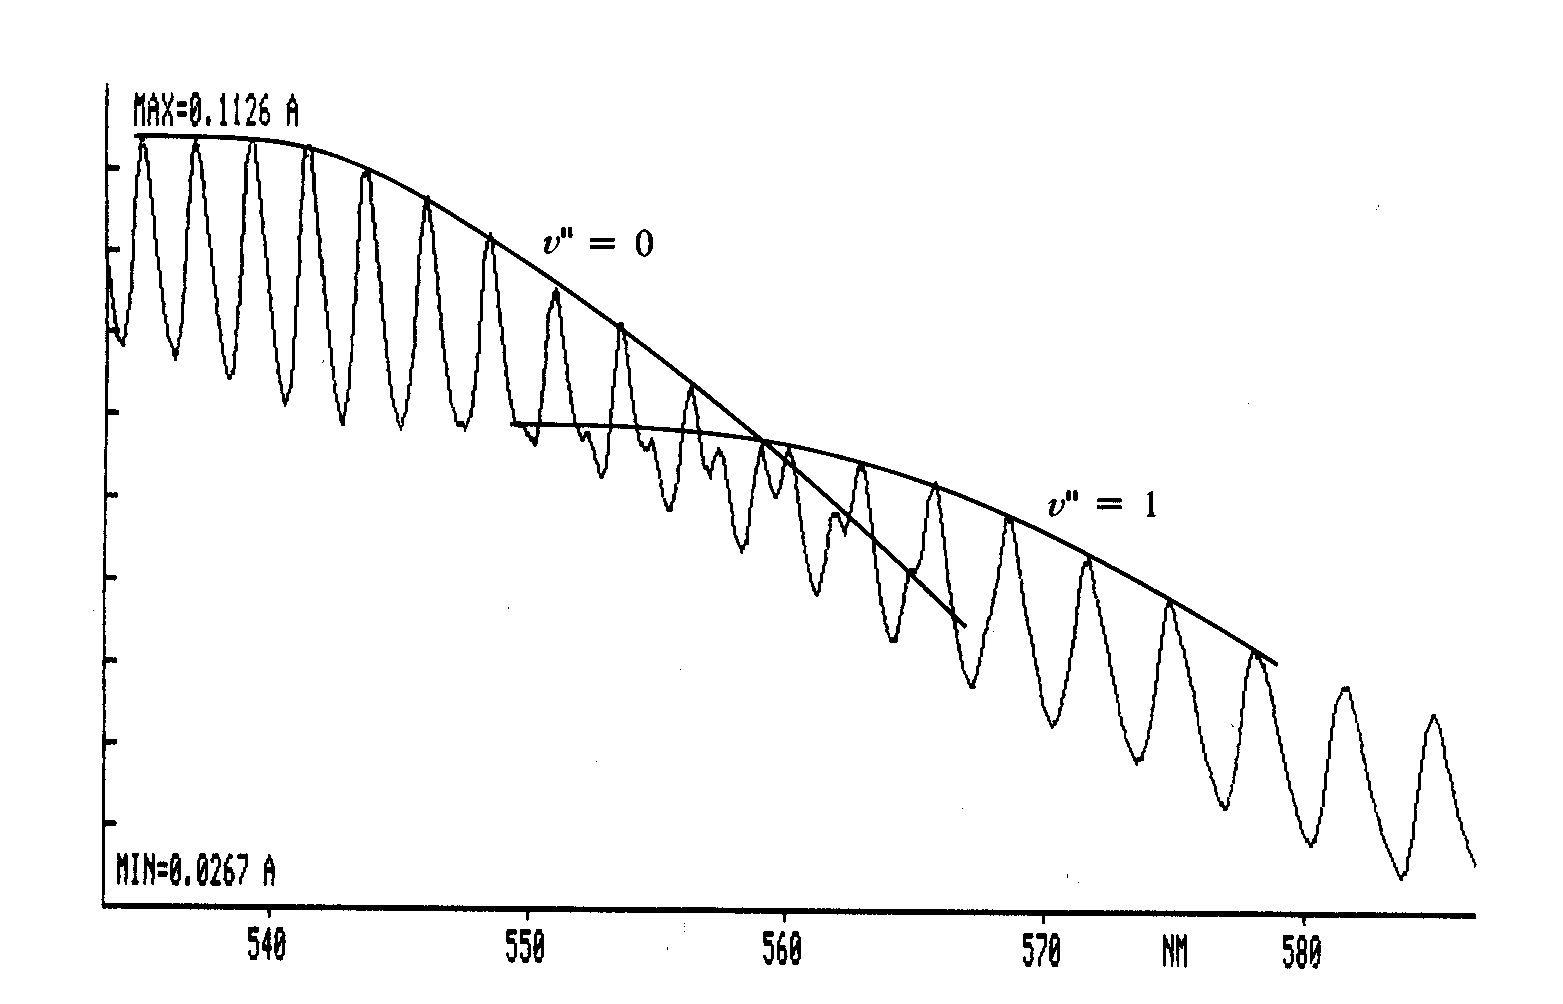
- Between 500 nm and 550 nm, all observed transitions originate in the state v"=0.
- At wavelength longer than about 550 nm, some "shoulders" appear on the absorption bands arising from the v"=0 to v' transition. These shoulders are "hot" bands arising from the v"=1 and v"=2 to v' transitions and will not be considered in this experiment. They can, however, cause some confusion in deciding which bands arise from the ground state. Figure 1 shows how the changing intensities can be used to identify the peaks that arise from the v"=0 band.
- Correctly assigning the v' numbers to the different absorption peaks can be difficult, because the v"=0 to v'=0 transition is too weak to be observable, and therefore the numbers cannot be obtained by simple counting. It is interesting to note that although the iodine spectrum was first measured in the beginning of the 20th century, the correct v' assignment was reported only in 1965 by Steinfeld et al.. You can use the results of that work for correct assignment. You can also use the facts that the v"=0 to v'=27 transition is located at 541.2 nm, and v"=0 to v'=29 transition is located at 536.9 nm.
- Prepare a Birge-Sponer extrapolation. Calculate the values of $ \tilde{\nu}'_e , \tilde{\nu}'_e x'_e $, D'0, D'e and E*; and compare these values with literature data.

Plot of intensity versus wavelength for molecular iodine. Curves indicate use of band intensities to identify lower state vibrational quantum numbers.
Laser Induced Fluorescence
- Run an initial low-resolution scan:
- Obtain a good low-resolution spectrum that will allow vibrational analysis at ∼60°C. Scan from 590 nm up to 720 nm using using different slit sizes to determine the optimal slit width. We reccomend measuring at 80°C with resolution of 0.01 nm.
- Assign numbers to the observed transitions. For a correct assignment, use the Franck-Condon factors from Table 1. These factors describe the relative intensities for fluorescence signals. From this table you can see:
- All anti-Stokes lines (with Δv<0) are from the v'=11 transition.
- Δv=1 and Δv=4 signals are dominated by fluorescence from v'=6.
- Δv=2 and Δv=3 signals contain significant contribution from both excitations.
- Δv=5 and Δv=6 signals are dominated by emission from v'=11.
- Prepare a Birge-Sponer extrapolation. Calculate $ \tilde{\nu}''_e , \tilde{\nu}''_e x''_e $, D''0 and D''e and compare with literature data. From these data and the data obtained from the B state, calculate the energy of excitation of the iodine atom and compare with literature values.
Table 1: Franck-Condon factors of rotational-vibrational transitions in iodine:
P(33)6<-3
R(127)11<-5
Dv
v'
v"
FCF
v'
v"
FCF
-5
11
0
2
-4
11
1
20
-3
6
0
0
11
2
68
-2
6
1
0
11
3
120
-1
6
2
3
11
4
100
0
6
3
21
11
5
20
1
6
4
55
11
6
9
2
6
5
100
11
7
68
3
6
6
120
11
8
68
4
6
7
83
11
9
2
5
6
8
2
11
10
33
6
6
9
0
11
11
65
 ,
, 
- Perform a high-resolution scan:
- Heat the fluorescence cell up to ∼80°C.
- Produce short scans of different Δv lines, especially for those that originate from v'=11, where the separation between transitions to J"=127 and J"=129 can be easily resolved.
- Assign all the peaks to the 11←5 and 6←3 transitions.
- Calculate the bond length and B" (rotational constant) of the iodine molecule.