Surface Tension
In this experiment you will explore the concepts of surface free energy, adhesion and wetting
Theoretical Background
Wetting is the process of making contact between a solid and a liquid. Controlling the wettability of solid materials is a classical and key issue in surface engineering. A few examples of wetting-dependent processes important in daily life, biology and industry include adhesion, printing, cleaning, painting and lubrication.
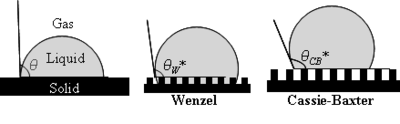
Most processes that involve liquids deal with situations where the free surface of the liquid meets a solid boundary, thus forming the so-called three-phase contact line; this is the line where solid,liquid and gas meet. The contact line can move along the solid surface, leading to "wetting" or "dewetting". The interaction between a liquid and a solid involves three interfaces: the solid-liquid interface, the liquid-vapor interface and the solid-vapor interface. Each of these interfaces has an associated surface tension, γ, which represents the energy required to create a unit area of that particular interface. A different approach is to regard γ as a force acting on the drop. This approach is shown in Figure 1, where γ appears as an arrow. At equilibrium, force equilibrium along the X axis provides a relation between the angle, θ, and the surface tensions of the three interfaces. This is called Young's equation:
where γSG, γSL and γLG are the surface tensions of solid/gas, solid/liquid and liquid/gas interfaces, respectively. θ is the angle between a liquid drop and a solid surface, called the contact angle.
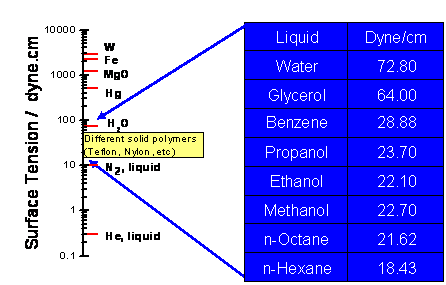
The magnitude of Young's contact angle is the result of energy minimization. If the liquid-gas surface tension is smaller than the solid-gas surface tension (γLG < γSG), the liquid-solid interface will increase to minimize energy. As the drop wets the surface, the contact angle approaches zero, leading to complete wetting. Other ratios of γLG and γSG will lead to the formation of drops of different shapes as shown in Figure 1. A hydrophilic surface is defined as a surface where 0°<θ<90°, and a hydrophobic surface is a surface where θ≥90°. The surface tensions of different substances in contact with the gas phase vary over a wide range is shown in Figure 2.

Interactions between Surfaces and Liquids
In order to understand why different surfaces and liquids form different contact angles, we must consider the interaction between the liquid and the surface and between the liquid molecules themselves. The adhesive force between the surface and the liquid causes the drop to spread and wet the surface, and the cohesive force within the liquid drop causes it to ball up and avoid contact with the surface. For example, let's consider the contact angles between water and three types of surfaces - polymer, metal and oxide.
- Some polymers, such as PVC and Teflon, form mainly Van der Waals interactions with a water drop placed on them. These interactions are weak relative to the hydrogen bonds within the drop, so that the water molecules interact mainly among themselves and not with the surface. The result is a bead shaped drop that almost does not wet the surface. These are hydrophobic surfaces.
- Oxide surfaces can form hydrogen bonds with the water molecules in the drop. These bonds apply strong forces on the interface, and so the water tend to wet the surface rather than ball into a bead. These are hydrophilic surfaces.
- Metal surfaces do not form strong hydrogen bonds with water; however their polarity is greater than that of PVC or Teflon, so their affinity to water is stronger. The result is that their contact angle is usually between that of the polymer surfaces and oxide surfaces.
The same considerations can be used to predict the contact angles of an organic liquids such as oil on different surfaces.
Controlling the Contact Angle
The surface tension and contact angle can be controlled through different methods.
- Temperature: Generally, surface tension decreases as the temperature increases. The dependence of surface tension on temperature is usually approximately linear reaching zero at the critical temperature (Figure 3).
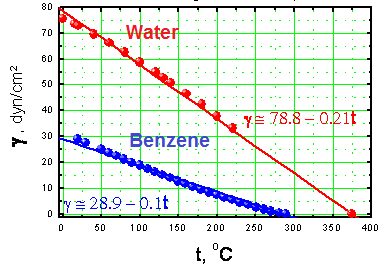
Surface tensions of water and benzene at different temperatures. - Surface roughness: Wenzel's model states that if the surface is rough and water penetrates into the roughness, whatever trend the flat surface showed will be enhanced. For example, a hydrophobic surface will become even more hydrophobic and a hydrophilic surface will become more hydrophilic as the surface roughness increases. According to the Cassie and Baxter model, the water drop does not penetrate into the surface grooves and instead lies on top of them, so that air bubbles are trapped between the surface and the water. The trapped air increases the contact angle and the surface becomes superhydrophobic. Both models are shown in Figure 4.
- Electro-wetting: When a potential difference is applied between the liquid and the solid surface, the electric force at the edges of the drop will pull it down onto the surface, lowering the contact angle.
- Chemical modifications: Chemical modification of the surface can lead to a change in its surface tension. For example, adding polar, hydrophilic groups to the surface will lead to a lower contact angle. The next section gives two concrete examples of such chemical modifications.
Surface Modifications
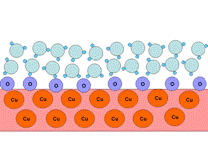
A metal surface is usually hydrophilic, especially if it is oxidized. A pure metal surface exhibits a strong interaction with the oxygen of water molecules (Figure 5a), whereas an oxidized surface forms hydrogen bonds with water (Figure 5b).
| a | b |
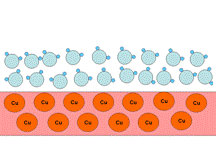 |  |
The most common way to make a surface hydrophobic is to modify it with sulfur-containing, HS-R, where R is an alkyl with more than six repeating units ((-CH2)n) in the chain. The interaction of these substances with a copper surface can be described as follows:
As a result of these reactions the metal surface is blocked from interacting with solvent molecules by the alkyl chains, replacing the strong metal-water interactions with weak interactions between water with saturated alkyl chains. If, instead of sulfur-containing alkyls, one uses substances like HS-R-X or (S-R-X)2, where R is a long alkyl chain and X can form hydrogen bonds (e.g., NH, NH2, SO2), then the modified surface will be hydrophilic.
| a | b | c |
 |  |  |
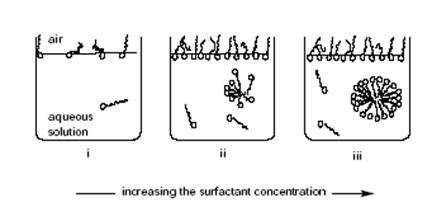
Effect of Surfactants on the Surface Tension of Water
Surfactant molecules accumulate preferentially at the liquid-vapor interface with the polar groups oriented toward the aqueous phase (Figure 7i). This positive adsorption of surfactant molecules lowers the liquid-vapor interfacial energy, and consequently the surface tension decreases. The surface tension continues to fall as the surfactant concentration increases until the critical micelle concentration is attained. At this stage the adsorbed molecules are closely packed, forming an oriented monomolecular layer (monolayer) (Figure 7ii). Above this concentration, additional surfactant molecules aggregate to form micelles in the bulk. This cooperative association process continues in the bulk with further increase of surfactant concentration, while at the surface of the solution the molecules remain in a highly condensed state. The concentration of free surfactant is essentially constant as the micelle concentration increases (Figure 7iii); free surfactant and micelles exist in dynamic equilibrium. The surface tension remains approximately constant
for the systems studied since it depends only on the liquid-vapor interfacial structure. The same type of behavior is found for the magnitude of the contact angle; that is, as the surfactant concentration increases, the contact angle decreases until a constant value is attained. For higher concentrations the contact angle remains approximately constant.
Zisman Plot
The surface tension at a solid/gas interface can be determined from a Zisman plot, which measures variation in contact angle as a function of the known surface tension, γLG, for a series of liquids. The experimentally obtained dependence of cos(θ) on γLG is often linear. The value for which cos(θ) extrapolates to 1 is termed the surface tension, γSG , of the solid/gas interface. A typical Zisman plot is shown in Figure 8.
The idea of this approach is as follows: a liquid with a surface tension less than or equal to the surface tension of a particular material will wet that surface (i.e., the contact angle will be 0°). This widely used approach can be applied only under proper conditions, however.
The Young equation at θ = 0 gives:
In contrast, by the Zisman approach, γSG = γLG. In other words, the liquid and solid studied must have an interface with γSL≈0. This approximation is accurate in the case of organic polymer solids and liquid saturated hydrocarbons or aqueous solutions of saturated alcohols at sufficiently high concentrations (>20%). This is the reason why the surface tension obtained from a Zisman plot is often referred to in the literature as the critical surface tension of wetting but not the surface tension of a solid/gas interface.