Thermodynamics
In this experiment you will learn about two ways to study phase transitions by analysis of iodine and of binary solutions.
Theoretical background
Introduction
This experiment consists of two parts:
- Analysis of the vapor pressure of binary mixtures.
- Study the thermodynamics of iodine using spectroscopy.
Vapor Pressure of Binary Mixtures
The vapor pressure is the pressure exerted by a vapor in thermodynamic equilibrium with its condensed phases (liquid and/or solid) at a given temperature in a closed system. The vapor pressure is governed by the Clausius-Clapeyron equation. As the vapor pressure increases, particles tend to escape from the liquid or solid state into the gas state and the substance becomes more volatile. The vapor pressure of a single element in a mixture is called the partial pressure. An ideal solution of two liquids (A and B) obeys Raoult's law, so for each component we have:
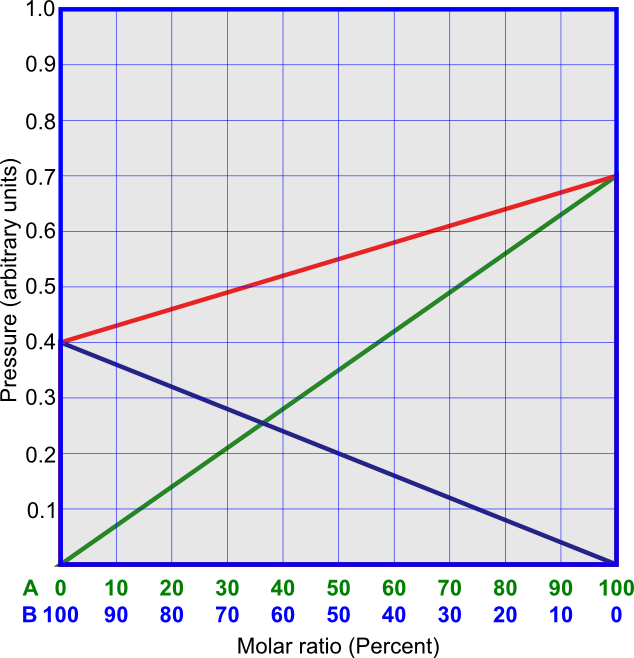
Where PA and PB are the partial pressures of the components above the liquid mixture, χA and χB are the mole fractions of each component in the liquid, and PA* and PB* are the vapor pressures of pure components. In an ideal solution, the total pressure is the linear sum of partial pressures. In a binary solution, this means that the total pressure is linearly dependent on the mole fraction, χA:
The underlying assumptions behind Raoult's law are:
- The solvent molecules are surrounded by other solvent molecules, so that all their interactions are among themselves.
- The solute molecules are surrounded by solvent molecules, so that all their interactions are with the solvent.
- There is no partial pressure associated with the interactions, only with the components.
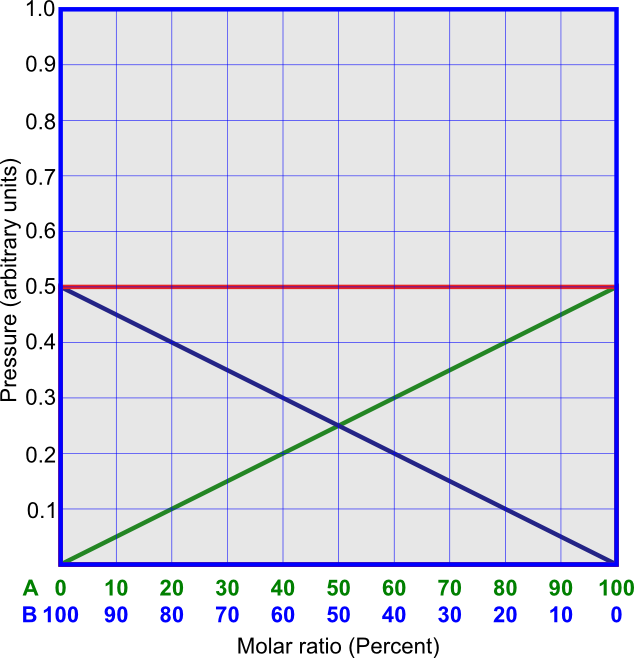
The linear dependence on χA is demonstrated in Figure 1. An example of ideal solution is that of C3H6Br2 and C2H4Br2. An interesting case is when the components of the solution are isotopically substituted substances, such as C12H3OH and C13H3OH. In this case, the pressures above the pure components are equal, and all interactions between molecules are the same, as in Figure 2.
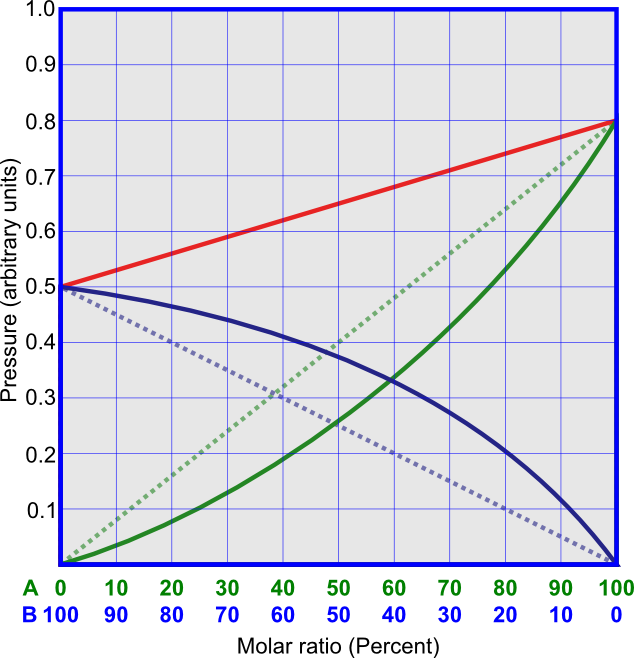
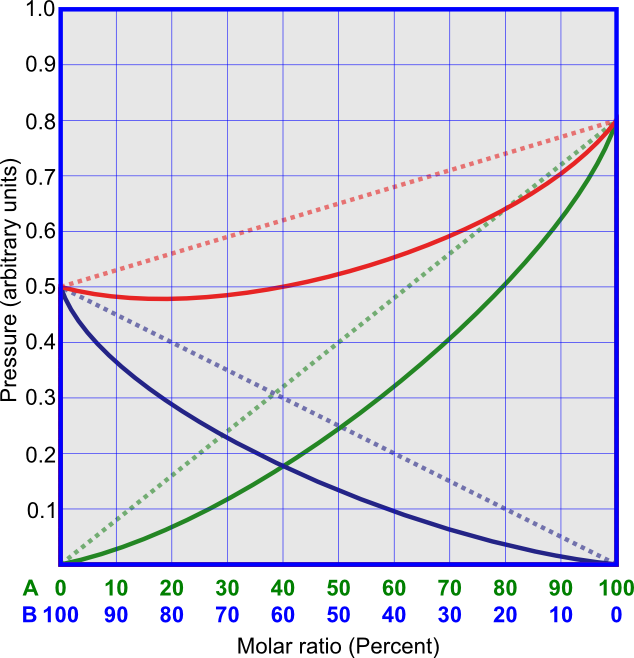
It is very difficult to find an ideal system, but it is possible to find quasi-ideal systems. In these systems, the energies of interactions between molecules of different components have intermediate values between energies of interactions between molecules of the same sort, so that the total pressures linearly depend on the content of the mixture. The overall pressure in this case appears to be ideal, but the partial pressure of each component deviates from ideal. This is shown in Figure 3. An example of quasi-ideal solution is that of benzene and toluene.
For non-ideal solutions two cases can be distinguished:
- Positive deviations from Raoult's law.
- Negative deviations from Raoult's law.
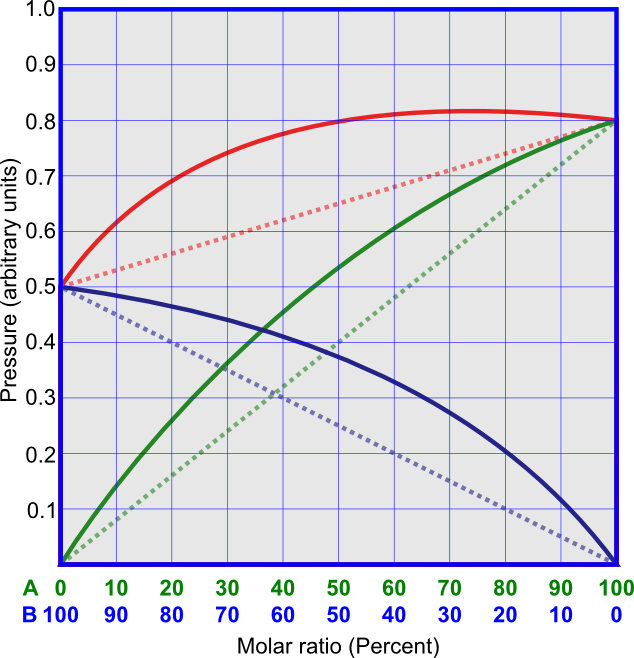
Non-ideal solutions that have positive deviations from Raoult's law (Figure 4) have vapor pressures that are higher than Raoult's law predicts. This is because the attractive forces between the molecules of different components are weaker than the attractive forces between the molecules of the same component. Saturated solutions of hydrocarbons and alcohols, or, for example, solution of CS2 and acetone, show positive deviations from Raoult's law.
Non-ideal solutions that have negative deviations from Raoult's law (Figure 5) have vapor pressures that are lower than Raoult's law predicts. This is because the attractive forces between the molecules of different components are stronger than the attractive forces between the molecules of the same component. An example for this kind of solution is that of chloroform and acetone.
It is important to note that there is no partial pressure associated with the interaction, only with the components!
Phase Diagrams
A phase diagram shows where transitions between thermodynamically distinct phases (i.e., solid, liquid, gas, super critical fluid) occur at equilibrium. Lines in the phase diagram mark the conditions where two phases can coexist, and where phase transitions occur. Triple points are points where three lines intersect, and where three phases can coexist. The most familiar phase diagrams are pressure-temperature diagrams of a single substance. Figure 6 shows a pressure-temperature diagram of iodine.

Another useful type of phase diagrams is the binary mixture phase diagram, usually showing temperature versus concentration at constant pressure. These diagrams are more useful than the pressure-concentration diagrams, since it is easier to control temperature than to achieve pressure control. An example of such a diagram is the boiling point diagram, which shows the transitions between the vapor and liquid phases at atmospheric pressure. Figure 7a shows the boiling point diagram of the benzene-toluene system, which exhibits ideal behavior. The upper line is called the dew point line, and above it the components can exist only in the vapor phase. The lower line is called the bubble point curve, and below it the components can exist only in the liquid phase. Between these lines both vapor and liquid are present, and the relationship between the two can be deduced from the diagram. Figures 7b and 7c show the non-ideal the methanol-benzene system, which has a positive deviation from Raoult's law, and the acetone-chloroform system, which has a negative deviation from Raoult's law.
 |
|
| a. Benzene-Toluene: ideal solution | |
 |
 |
| b. Methanol-Benzene: positive deviation | c. Acetone-Chloroform: negative deviation |
For further information about phase diagrams, see the Recommended Literature section.
Thermodynamics of Iodine
In the second experiment, you will measure the enthalpy of sublimation of crystalline iodine. In order to do this you need to measure the dependence of the vapor pressure of iodine on temperature. This can be done by spectrophotometric measurements of the absorbance of the iodine vapor.
Blackbody Radiation
Blackbody radiation is a common phenomenon that probably is familiar to you. When you see stars of different colors, when you observe an electric heating-coil on a stove turn red, or when you observe a light bulb, you are observing blackbody radiation.
A black body is an idealized physical body that absorbs all incident electromagnetic radiation, regardless of frequency or angle of incidence. A blackbody in thermal equilibrium emits electromagnetic radiation called black-body radiation, in quantity that is determined by its temperature alone. Heating a blackbody object to different temperatures causes that object to radiate energy of different wavelengths and, therefore, different colors. The lamp of a spectrophotometer behaves as a blackbody, and in this experiment you will learn how to calculate its temperature. Think about why it is a good approximation to refer to the heating lamp (in our case tungsten) as a black body. Does the lamp absorb all electromagnetic radiation?
Until the development of the quantum theory, physicists did not understand what caused the emission of radiation at different wavelengths. In the early 20th century, a formula, called Rayleigh-Jeans law, was developed empirically (by experiments). The formula describes the emission spectrum of the blackbody, at all wavelengths, for a given temperature. However, when this equation is integrated from zero to infinity (with respect to frequency/wavelength), the total emission at all wavelengths is infinite, which is not compatible with the Energy Conservation law. This mismatch is known as the ultraviolet catastrophe, because the formula is more suitable for longer wavelengths, but diverges from experimental data in the ultraviolet range. The ultraviolet catastrophe is caused by the fact that in classical physics (based on statistics) the harmonic oscillations (degrees of freedom) of the system in equilibrium have an average energy proportional to the temperature, T. According to the laws of classical electromagnetism, the number of fluctuations in the body cavity is proportionatal to the frequency squared. Therefore, the intensity at a given frequency and the total radiation intensity are limitless as the frequency increases.
where: L is the spectral radiance per unit wavelength, λ is the wavelength, λ=c\𝒱 , 𝒱 is the frequency, c is the speed of light, T is the temperature, and kB is Boltzmann's constant.
This is of course not accurate because the total observed intensity of radiation cannot be infinite!In order to resolve the ultraviolet catastrophe, Max Planck assumed that energy is emitted from a blackbody in discrete doses of energy (energy quantum; e.g., photon). Essentially, he assumed that the energy doses are the multiples of a basic dose, which depends only on frequency. This was one of the basic assumptions that led to the development of the quantum theory. With Planck's assumption, the number of modes of vibration in a given energy at high frequencies in the body cavity is significantly smaller, so that the average energy of these frequencies is also reduced. The intensity of the radiation finally subsides to zero at "infinite" frequencies and the total power is finite as expected from the Energy Conservation law. The spectral radiance of a blackbody radiation is given by Planck's law:
where h is Planck's constant.
The spectral radiance integrated over all solid angles gives the radiation density:
Indeed, at the limit of low frequencies (i.e., long wavelengths) predictions from Planck's law agree with those from the Rayleigh-Jeans law. This is the correspondence principle, which states that the behavior of systems described by the theory of quantum mechanics is the same as behaviors described by classical physics. At the limit of high frequencies, Planck's law tends to Wien's Displacement law:
Plank's radiation density depends on temperature. Figure 8 shows Plank distributions of radiation density (ρ) versus wavelength at three different temperatures.
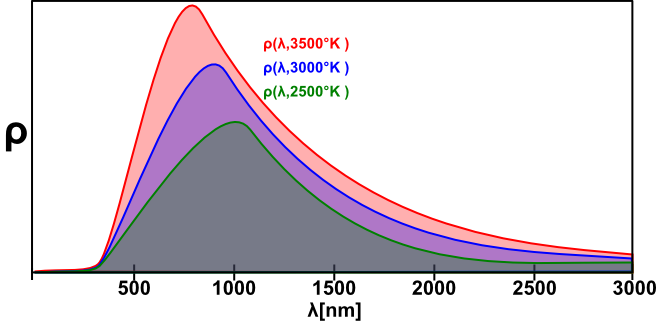
You can see that at 2500 K, which is close to the lamp temperature in our experiment, the peak of the radiation is about 1000 nm, which is beyond the limits of our spectrophotometer. For this reason, direct calculation of the lamp temperature (e.g., using Wien's law) is impossible, and we must turn to other means. If we assume that in our wavelength and temperature range (λ≤800 nm; T≤5000 K) ehc/λkBT ≫ 1 (you should check this assumption), then equation (5) becomes:
and after some algebra we get a non-analytic solution to the equation:
Here B=ln(8πhc2) is a constant. If we draw a graph of ln(ρ(λ,T)·λ5) as a function of λ-1, the temperature may be calculated from the slope of the graph. In order to get ρ(λ,T) from the experimental data you have to take into account that measured signal of the blackbody radiation also depends on the effectiveness of the diffraction grating, G(λ), and the effectiveness of the charge-coupled device (CCD), S(λ). The measured signal is, then: I(λ) = G(λ)·S(λ)·ρ(λ,T).
Enthalpy of Sublimation
We wish to use the absorption spectrum to calculate the enthalpy of iodine sublimation. To do this, we will measure how much of the light's intensity is absorbed by the iodine molecules in their gas phase. As more iodine sublimes, there will be more gas molecules, and therefore more light will be absorbed. The intensity of absorbed light is given by the Beer-Lambert Law:
where I is the intensity after passing through an absorbing medium, I0 is the incident intensity (intensity at the source), σ [m2] is the cross section of light absorption by a single particle, n [1/m3] is the density of absorbing particles, c [mol/m3] is the concentration; x [m] is the distance traveled in the absorbing medium, and ε is the molar absorptivity [m2/mol].
The middle term of equation (9) is usually used for gases and the right term is used for liquids. We will use the middle term in this experiment. If you are unfamiliar with the term "cross section of absorption", you can find an explanation here. In short, the cross section of absorption is a measure of the probability that two particles (in this case, a photon and a molecule) will interact. The absorbance of a medium is defined as:
Notice that in this calculation we assume that the absorption is linear with the density, (i.e., the cross section of absorption is independent of the concentration).
We will assume that the iodine vapor behaves as an ideal gas, and therefore:
Here n=N/V, where N is the number of molecules and n is the molecular density, which appears in equation (9). We can now relate equations (10) and (11):
In order to relate the pressure to the enthalpy we will use the Clausius-Clapeyron equation:
Equations (12) and (13) now give us a non-analytic solution to the equation:
Assuming the enthalpy of sublimation does not depend on temperature, the enthalpy of sublimation can be calculated from the slope of the graph of ln(AT) as a function of T-1.
How does the enthalpy of sublimation depend on the temperature, and how will this dependence influence the results?