Thermodynamics
In this experiment you will learn about two ways to study phase transitions by analysis of iodine and of binary solutions.
Experimental Setup
Experimental Setup – Binary Solutions
The experimental setup for analysis of the vapor pressure of binary mixture is pictured in Figure 1.
Components:
- Vacuum pump
- Vacuum gauge (denoted 1 in the figure below)
- Experiment chamber (denoted 2 in the figure below) connected to the pump control valve (denoted 3 in the figure below)
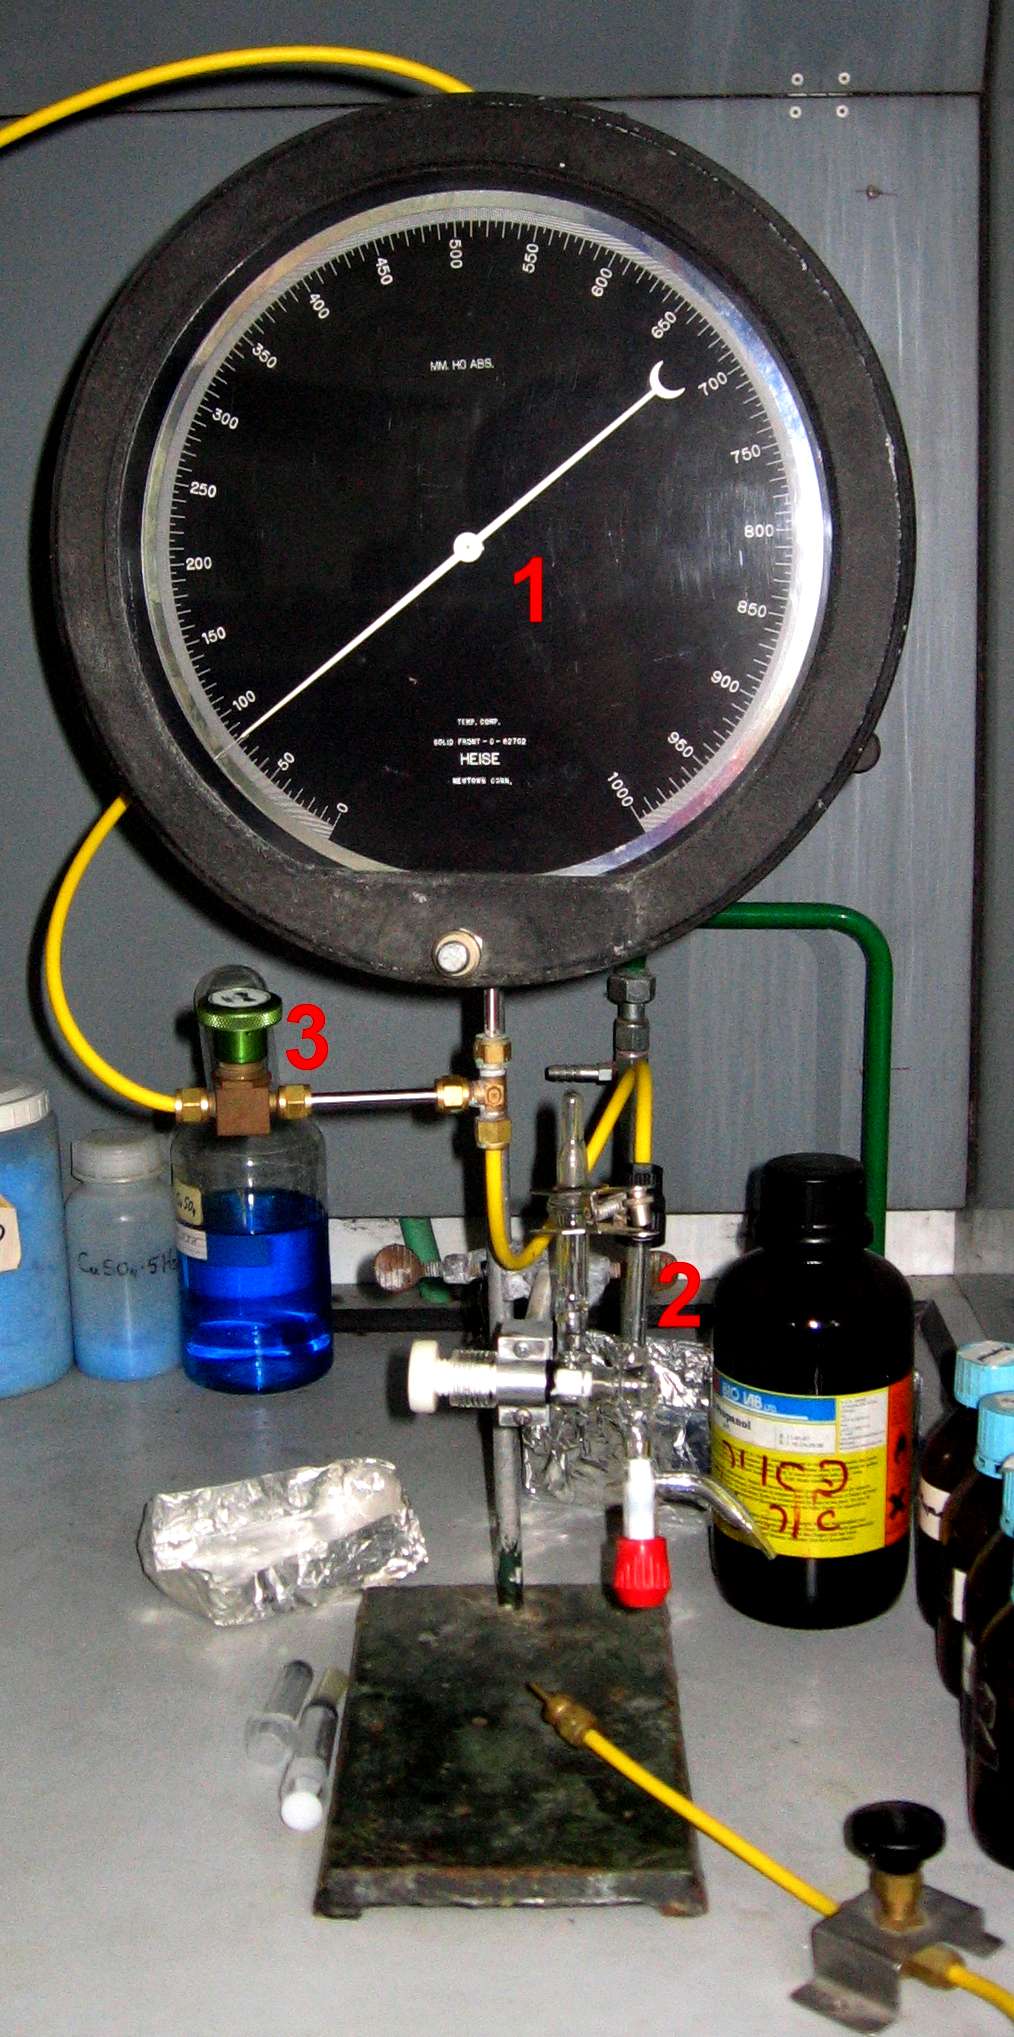
Vacuum Pump
The experimental chamber is connected to a rotary vacuum pump that can provide a minimal pressure of 10-2-10-3 Torr. More information on rotary vacuum pumps can be found by reading the section in Experiment 2 "Vacuum Techniques" here. Additionally, general information on other types of vacuum pumps may be found here.
Experimental Chamber
A close-up of the experimental chamber area is shown in Figure 2.
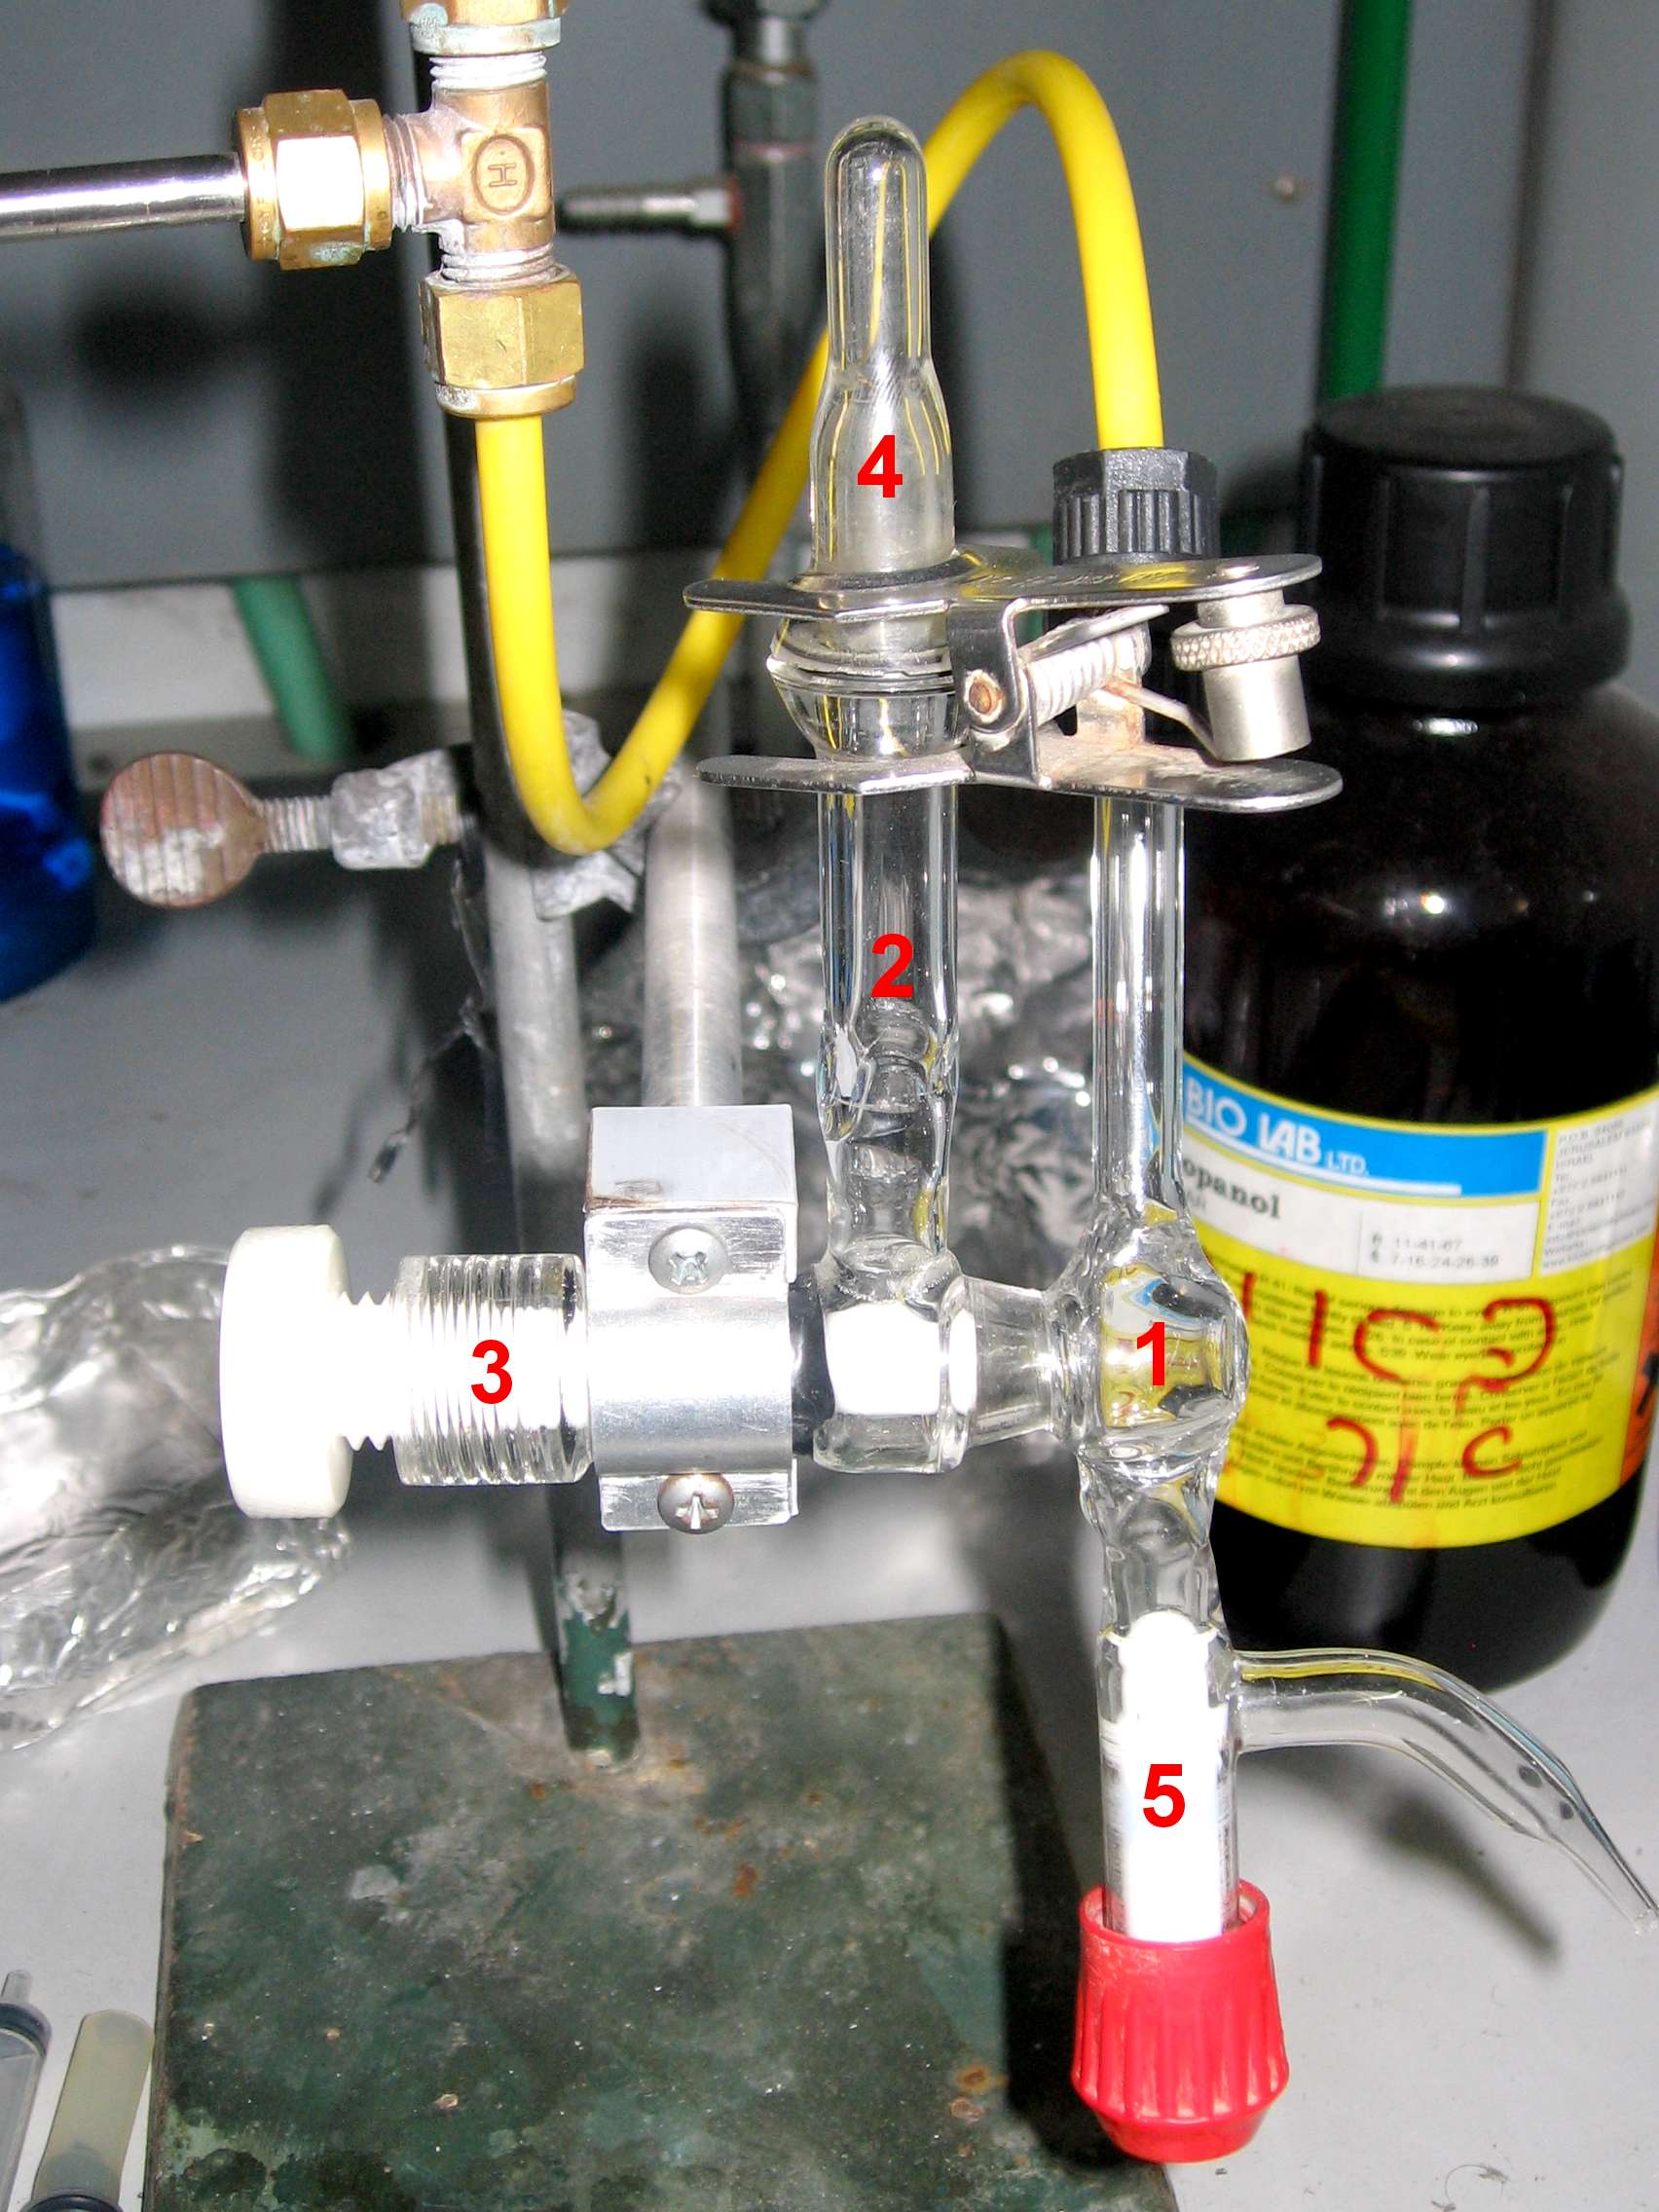
In order to measure the vapor pressure of a solution:
- Make sure that plug 3 is open and plugs 4 and 5 are sealed.
- Open the valve to the vacuum pump, pump down the pressure in the chamber, and close the valve. The pressure in vacuum is supposed to be around 1 Torr.
- Close plug 3, open plug 4, and insert the solution. Make sure that no air bubbles are trapped at the bottom of the chamber.
- Close plug 4, and open plug 3 slightly to allow the solution to fill the experiment chamber to between one-half and one-third full.
- Close plug 3, allow the pressure to stabilize and take a reading.
In order to clean the chamber:
- Open plug 4.
- Slowly retract plug 3 until it is completely open.
- Place a "waste" cup under the exit funnel. Open plug 5 and allow all the liquid to drain.
- Close plugs 4 and 5. Open the valve to the vacuum pump, pump down the chamber, and close the valve.
- If the pressure is steady at 0, then the chamber is clean. Otherwise, repeat this sequence.
Experimental Setup – Sublimation of Iodine
In this experiment we will use the following devices shown in Figure 3:
- Ocean Optics CHEM2000 spectrometer:
- LS-1 Tungsten Halogen Light Source (1).
- Optic fiber, which collects transmitted light and transfers it to the detector (2).
- Detector composed of diffraction grating and CCD.
- Software.
- Iodine sample (3):
- Copper cuvette containing solid iodine.
- Heating lamp.
- Power source for the heating lamp (4).
- Thermocouple and voltmeter (5).
.jpg)
The power source (4) powers the LS-1 tungsten halogen light source (1), which generates the light that is transmitted through the iodine sample (3) to the detector (2). The iodine chamber is interfaced with a termpocouple and voltmeter (5).
Light Source
The light source is a tungsten halogen lamp, with an approximate color temperature of 2800 K. You can find more information about the light source here and here.
Spectrometer
The Ocean Optics CHEM2000 spectrometer is shown in Figure 4.
Detector
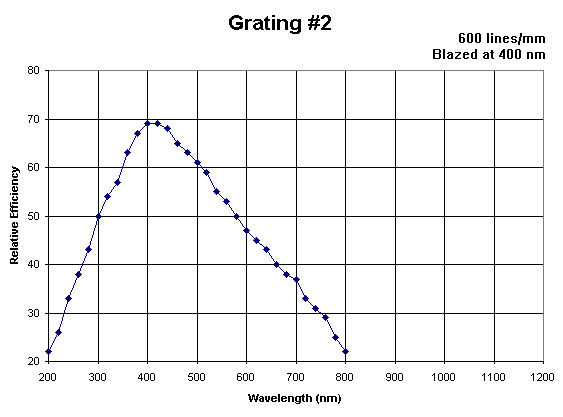
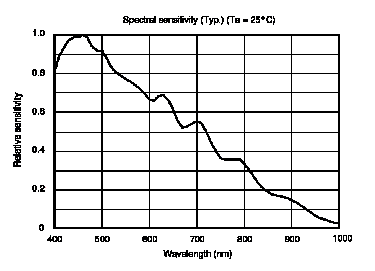
The detector in the spectrometer is made of two parts: 1. The diffraction grating is used to break the polychromatic light into the wavelengths composing it. You can read more about its operation in Experiment 1 "Spectrum of The Hydrogen Atom" sections 3.2.1 and 3.2.2 (here). 2. A CCD is used to record the signal. You can learn more about a CCD and how it works here and here. It is important to note that the spectral efficiencies of the grating and the CCD affect the measured signal, so that:
$$I(λ) = G(λ) ⋅ S(λ) ⋅ p(λ,T)$$
where I(λ) is the measured signal, G(λ) is the spectral efficiency of the diffraction grating, S(λ) is the spectral efficiency of the CCD, and ρ(λ,T) is the actual intensity that reached the detector. The efficiency curves for the grating and the CCD are given in Figure 5 and 6.
Software
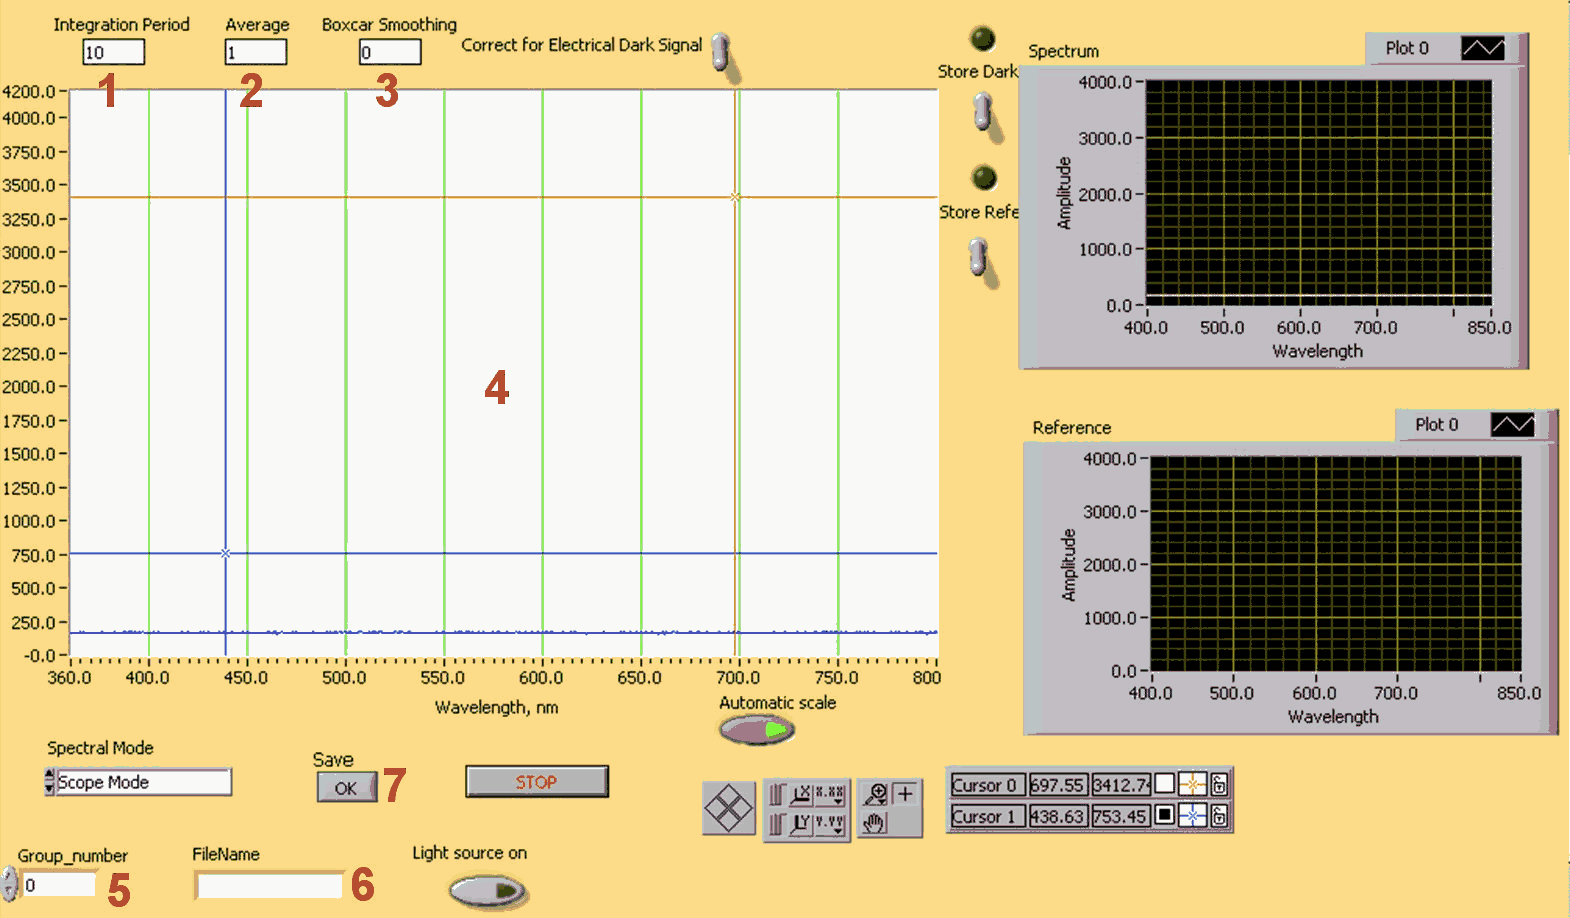
The program that drives the spectrometer continuously reads the information from CCD. The spectrum can be viewed in the graph area, marked 4. You can adjust three parameters of the detection process:
- Integration period (marked 1 in Figure 7): The integration period is the time, measured in milliseconds, when the CCD collects light. This time is similar to the exposure time in a photo camera. When this time is finished the collected signal is transferred to the computer. Thus if you increase this time the sensitivity of the CCD array to the constant signal increases, but the information on the computer monitor will change less frequently. The integration time of the spectrometer is analogous to the shutter speed of a camera. The higher the integration time, the longer the detector “looks” at the incoming photons. You should adjust the integration time so that the greatest amount of light that you anticipate for your application causes a signal of about 3500 counts. While watching the graph trace, adjust the maximal integration time until the signal intensity of approximately 3500 counts.
- Average period (2): This is a signal averaging function. The average period is equal to the number of spectra averaged. The higher the value, the better the signal-to-noise ratio (S/N). The S/N will improve by the square root of the number of scans averaged. This parameter also decreases time resolution. It does not affect the sensitivity.
- Boxcar smoothing (3): Boxcar smoothing is a technique that averages across spectral data. This technique averages a group of adjacent detector elements. A value of 5, for example, averages each data point with 5 points to its left and 5 points to its right. The greater this value, the smoother the data and the higher the S/N. The maximum value allowed is 50 pixels. However, if the value entered is too high, a loss in spectral resolution will result. The S/N will improve by the square root of the number of pixels averaged.
In order to save your results, fill in your group number (5) and a file name (6), and then press OK (7). Your data will be saved in D:\data\group number\file name.
All data analysis will be done externally (e.g. in Microsoft Excel).
Iodine Sample

Figure 8 shows the sample holder of the spectrometer. The cuvette in the photo contains solid iodine. A window allows light to pass thorough the sample. The holder also has a heat lamp. A hole in the cuvette cap allows placement of the thermocouple. It is important to keep the sample holder upright after the experiment is done so that the iodine will re-solidify on the bottom of the cuvette and not on its walls.
Heat Lamp
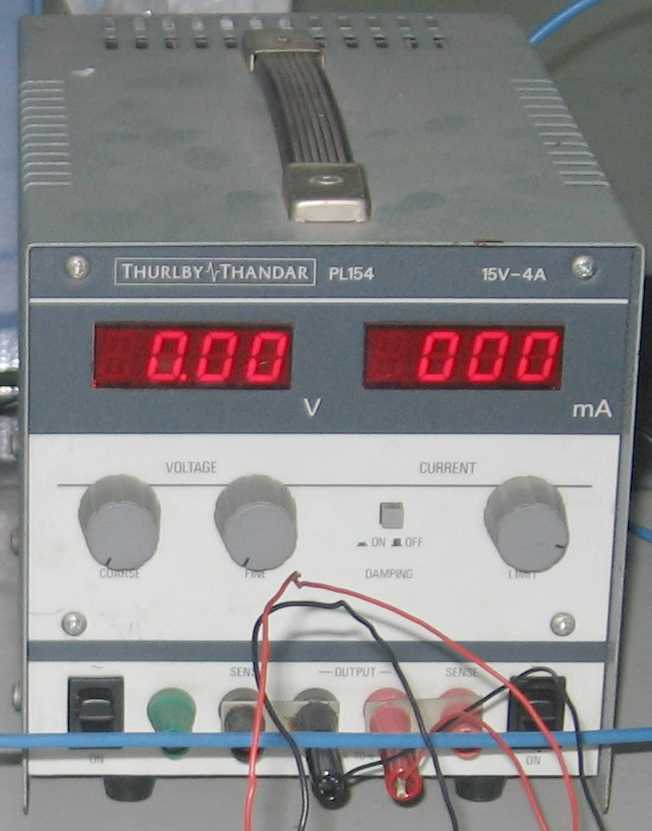
Connect the heat lamp to the power source shown in Figure 9. During set up, the switch on the right should be turned down (on), while the left switch should be up (off). During the experiment both switches will be on. The far right knob should be turned until the desired current is shown in the right-hand display. The current should not reach a value higher than 3 A. The left-most knob controls the voltage, and its value can be monitored in the left display. When you finish working, turn the voltage to 0, and turn both switches off.
Thermocouple
A thermocouple is a temperature sensor, made of two different metals touching each other. At the junction, the temperature leads to potential difference between the two metals, which can be measured. You can find a more detailed explanation here. In this experiment we will use a type K Chromel (90% Ni and 10% Cr) - Alumel (95% Ni, 2% Mn, 2% Al and 1% Si) thermocouple.
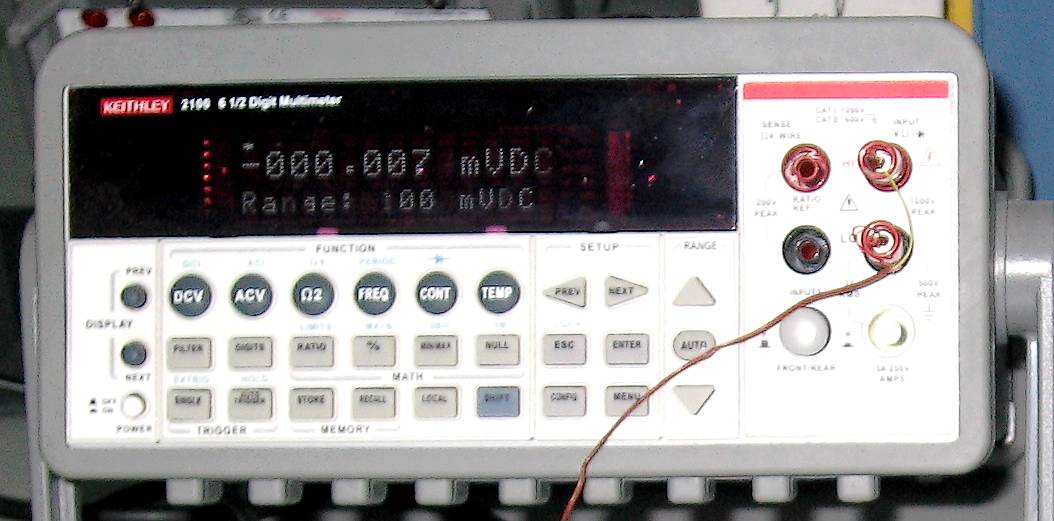
The thermocouple is connected to a voltmeter as shown in Figure 10. Make sure that the "DCV" option is chosen! You can use this table to convert the measured voltage to temperature. It is important to remember that the thermocouple measures the difference between the temperature at its tip and a reference temperature, room temperature in our case!