
CTV:Ancient Technology
Slag Vitrification and Smelting Technology: Tracking 7,000 years of copper production in Timna
Abstract
Since the late 1950s, the Timna Valley in southern Israel has served as a “field laboratory” for the study of archaeometallurgy in a hyper-arid zone. It is one of the best-preserved ancient copper mining and smelting regions in the world, with evidence of metallurgical activity spanning 7000 years. As part of the Central Timna Valley Project (CTV) we attempt to assess major technological developments from the longue-durée perspective, focusing on smelting activities and its most common byproduct, slag. In the current study, we test the hypothesis that the proportion of the slag’s glassy phase (amorphous non-crystalline solids) constitutes an additional proxy for different smelting technologies, assuming that in more advanced technologies the percentage of glass would be higher, due to higher temperatures, improved reducing conditions, lower viscosity and more efficient tapping. We, therefore, applied a systematic chemical and mineralogical analysis of slag samples from five smelting sites corresponding to five distinct copper production periods. These were classified as distinct technological phases, characterized by variables such as slag typology, furnace structure, heating methods and fluxing agents. In relative chronological terms, the sites correspond to the Early Bronze Age, Late Bronze Age, Iron Age I, Iron Age IIA and Early Islamic Period. The absolute datings of the sites were established by Carbon-14 analysis and archaeomagnetic dating. To specifically characterize the quantity and quality of glass within the slag samples, our research applied X-ray diffraction and SEM image segmentation at Vanderbilt University, the Pacific Northwest National Laboratory, and Tel Aviv University. A more detailed description of the methodology and preliminary results are detailed below. The research is still ongoing with further analyses, observations and conclusions expected in the coming months.
Archaeological Goals: • Identifying technological patterns in the various chronological periods of Timna’s smelting activity. • Interpreting smelting technologies in their respective chronological timeframes as well as in a study of the longue-durée. • Understanding the technological development of copper smelting throughout Timna’s active production phases.
Research Background
Research Questions: Can the amorphous phase inside copper slag present a proxy for varying ancient smelting technologies? 1. Quantity of glass inside the slag 2. Quality of glass inside the slag 3. Distribution of glass inside the slag
Research Background: • Timna’s five main smelting activity periods: 1. Early Bronze Age 3500-2200 BCE 2. Late Bronze Age 1400-1100 BCE 3. Early Iron Age 1100-950 BCE 4. Iron Age II 950-800 BCE 5. Early Islamic 650-1000 CE
Research Material
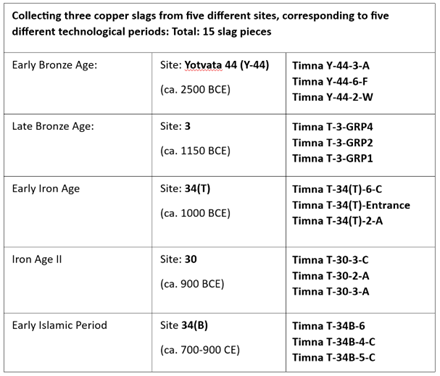
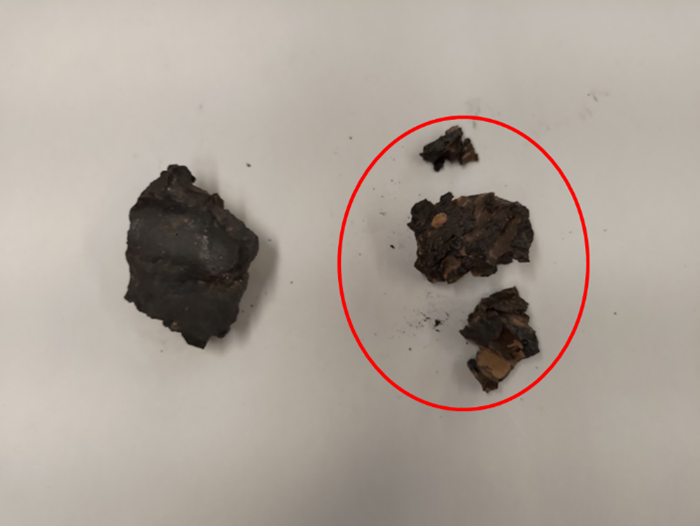
Three copper slags from five different sites, corresponding to five different periods: Total: 15 slag pieces
Main Analytical Methods: 1. XRD (Quantitative) Quantifying minerals and amorphous phases in the slag Sample State: Powder • Quantitative Crystallographic and Elemental compositio. 2. SEM-image segmentation (Quantitative, Qualitative, Distribution) Mapping in-situ crystallographic and amorphous phases inside the slag Sample state: Solid Cross-Section • Mapping, Structure, Spatial Crystallographic and Elemental composition • Software: Aivia: Classifying different greyscale pixel color-patterns into different segments by manual teaching and then having AI learning apply said color-patterns on the entire image or other images.
Analytical Goals: • Identify the different mineralogical phases in the copper slag samples from the five smelting sites, originating from five different chronological periods. - Distinguish specifically between pores, metal droplets, crystalline and amorphous phases. • Understand the characteristics of the amorphous phase. - Calculate the proportion of the amorphous phase within each slag sample. - Analyse the spatial distribution of the amorphous phase within each slag sample. • Ascertain any other correlation between the characteristics of the amorphous phase and other mineralogical phases. • Observe if there is a correlation between the XRD and image segmentation results.
Research Procedure
Sample Preparation
Sample Selection: • After locating three (large enough) intact slags from each site (total: 15 Slag pieces), each intact slag was separated into two samples for two purposes: 1. Powder: Plate crushing and ball-milling (for XRD) 2. Solid Cross-Sectioning: Epoxy mounting and polishing (for SEM segmentation) • Samples: Two from each slag 15 for sectioning 15 for powder Total: 30
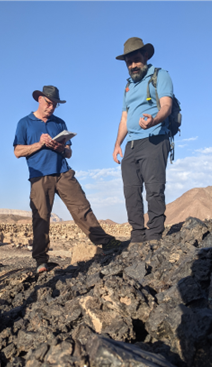
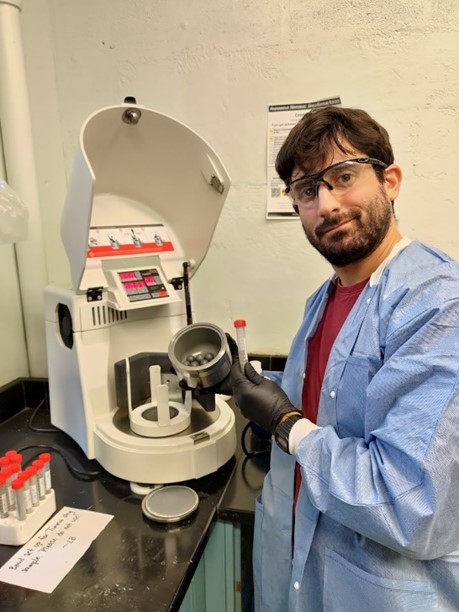
Prof. David Kosson and Prof. Erez Ben-Yosef collecting samples in Timna. November 2022
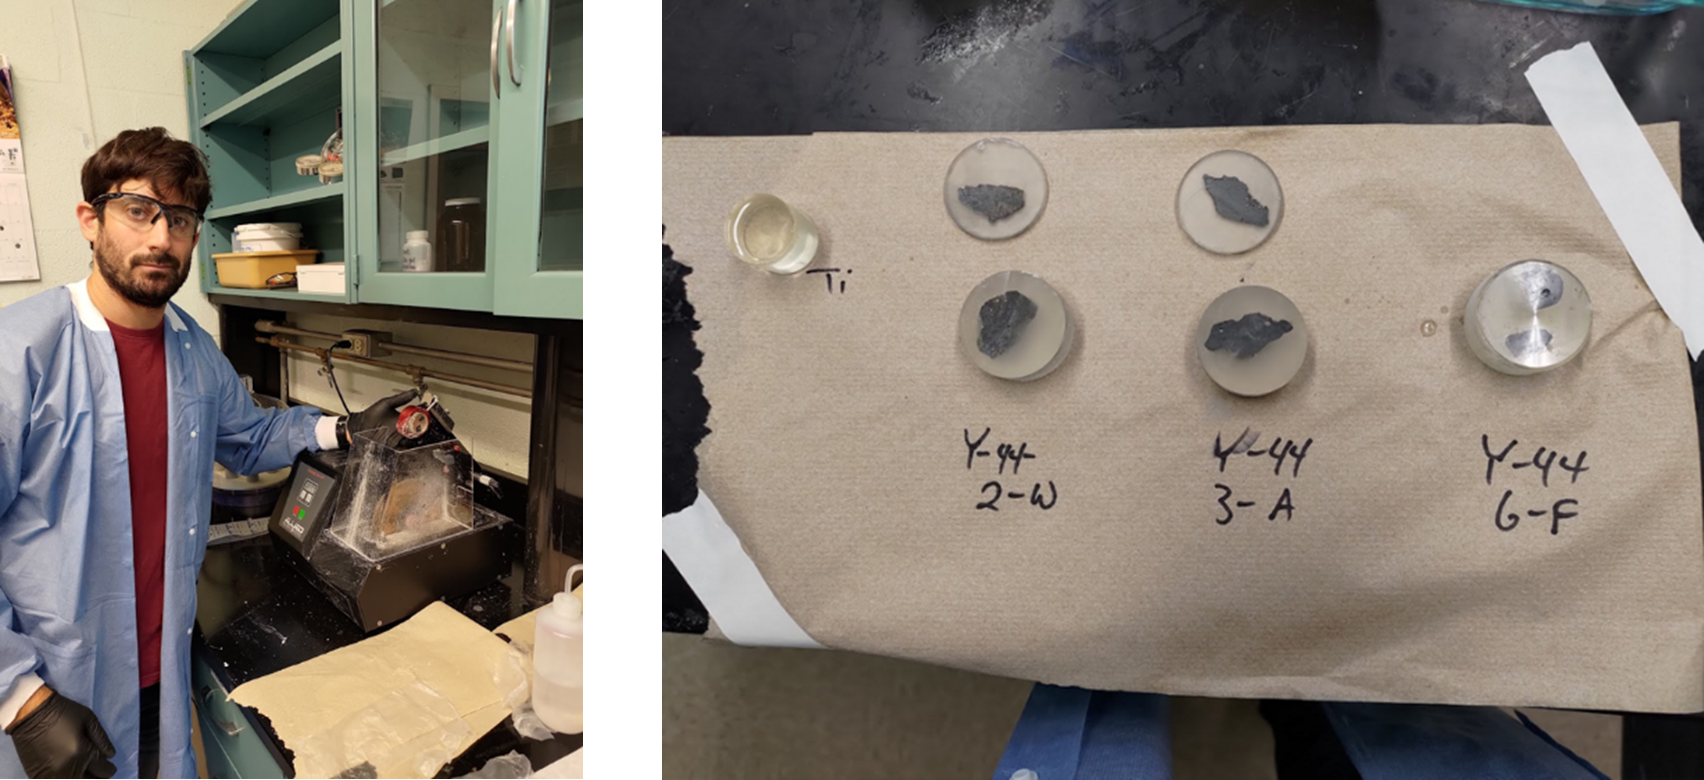
1. Solid Cross-Sectioning: Procedure • Dry-sawing or chiseling the slag (shared with powder procedure)

Dry-sawing or chiseling the slag (shared with powder procedure)
• Extracting a small piece ca. 4x4 cm with an appropriate internal section
Extracting a small piece ca. 4x4 cm with an appropriate internal section
• Epoxy mounting and 18 hours hardening period
Epoxy mounting and 18 hours hardening period
- Wet-sawing both ends for surface flatness
Wet-sawing both ends for surface flatness
• Polishing procedure
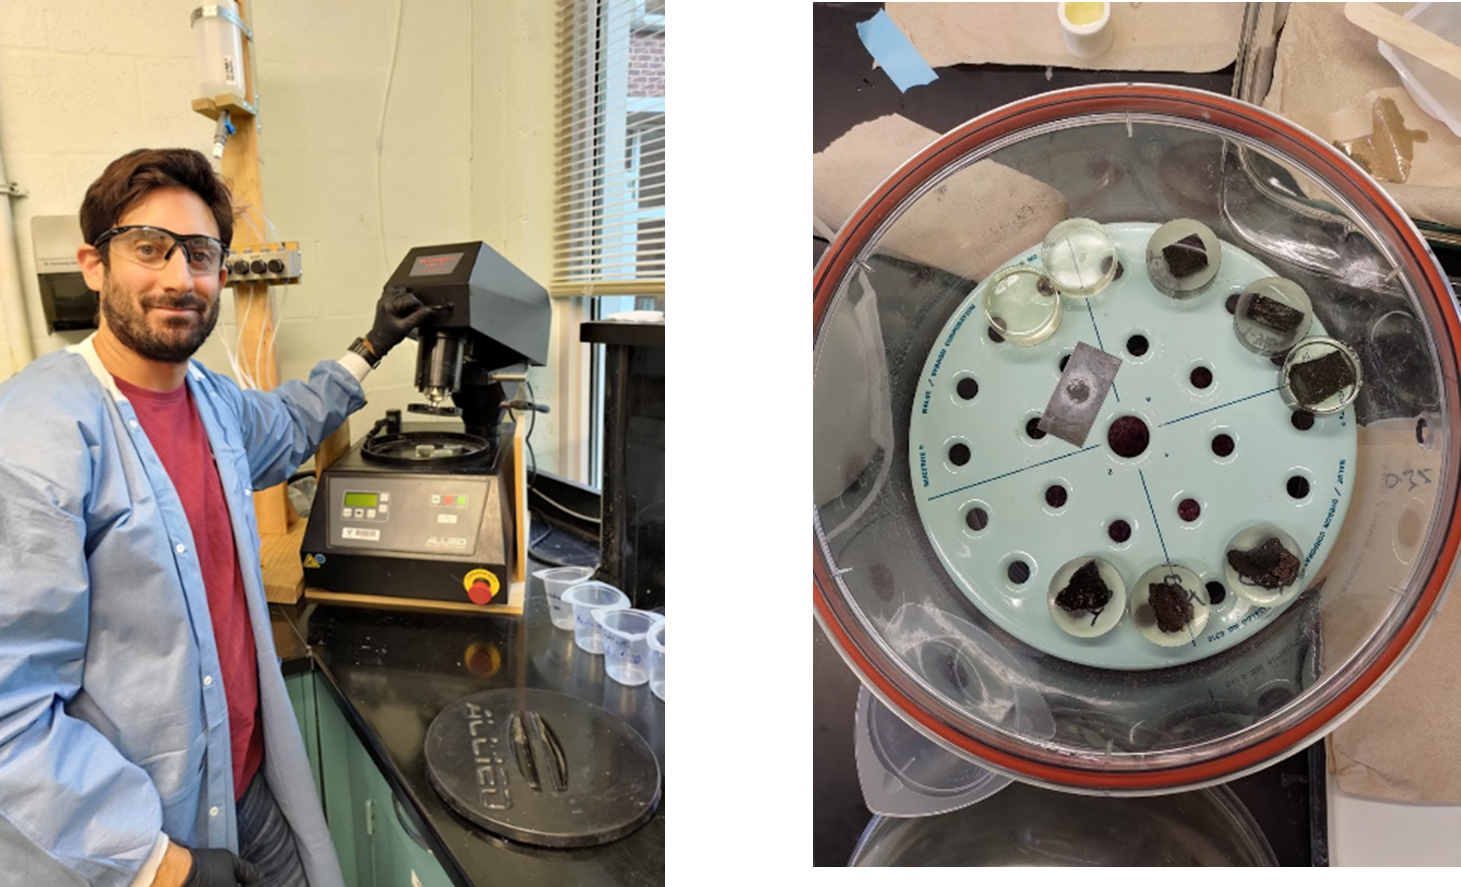
Polishing procedure
• Polished Samples- Ready for SEM-EDS
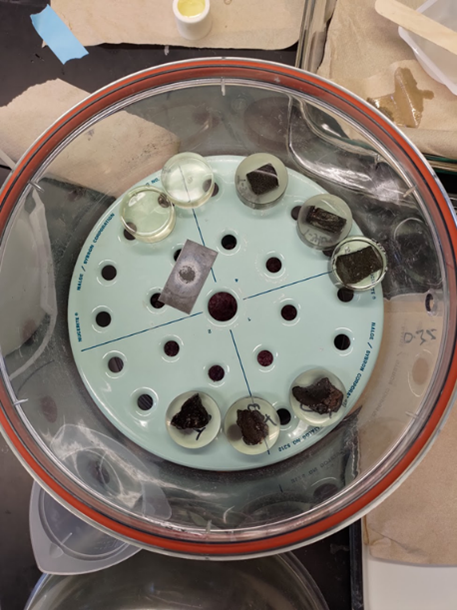
Polished Samples- Ready for SEM-EDS
2. Powder: Procedure • Dry-sawing or chiseling the slag (shared with the cross-sectioning procedure)
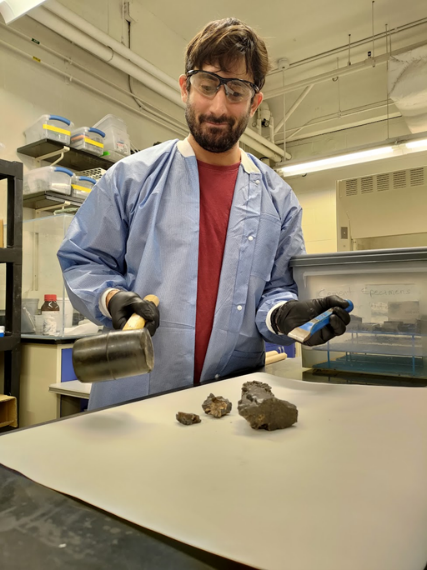
Dry-sawing or chiseling the slag (shared with the cross-sectioning procedure)
• Extracting either several pieces or a small enough piece for the plate crusher
Extracting either several pieces or a small enough piece for the plate crusher
• Plate-crushing to rough grains
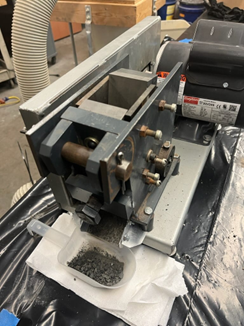
Plate-crushing to rough grains
• Ball-milling to fine powder
Ball-milling to fine powder
- Polished Samples- Ready for SEM-EDS
Polished Samples- Ready for SEM-EDS
XRD
Analysis was performed on all 15 pulverised slag samples.
- The pulverising procedure produced around 10 to 15 ml of powder from each slag sample.
- The XRD was performed by the Environmental Molecular Sciences Laboratory through the Pacific Northwest National Laboratory.
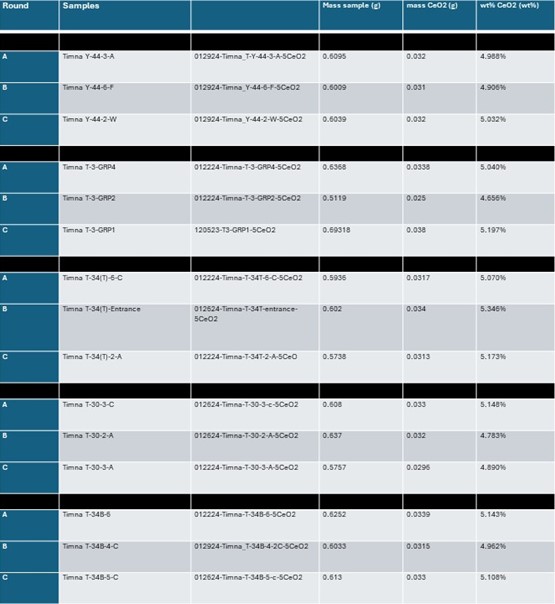
Table of all 15 pulverized samples sent to PNNL for XRD.
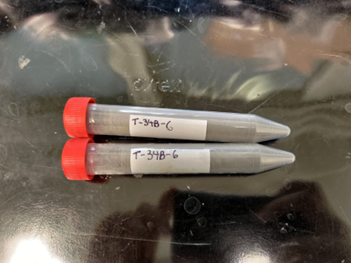
SEM Image Segmentation Samples segmented between March 4th-15th 2024: Rand A: 1. Y-44-3-A 2. T-3-Group 4 3. T-34(T)-6-C 4. T-30-3-C 5. T-34(B)-6 Methodology
1. Grid Separation
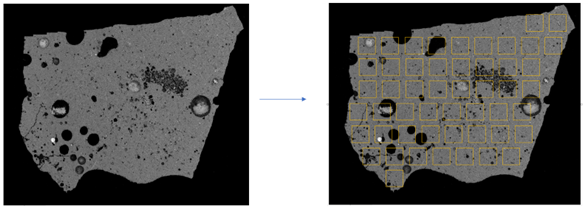
Grid Separation- Sample image systematically separated into 2x2 mm squares in a grid system with 0.75 mm spacing between each square
2. Montaging on Aztec
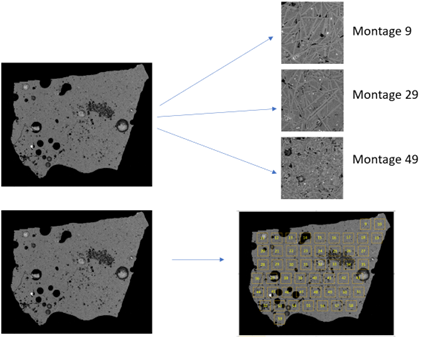
Montaging on Aztec- Manually separating the full image in the corresponding 2x2 mm square montages.
3. Batch Exporting
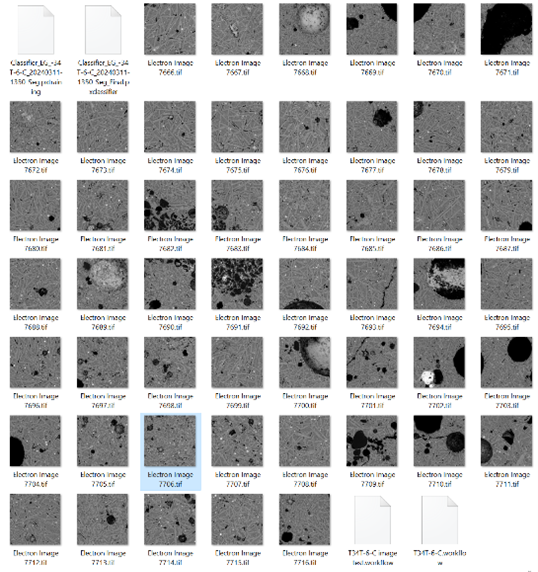
Montages exported from Aztec as .tiff and uploaded to Aivia
- Aivia Classification- Training and AI-learning
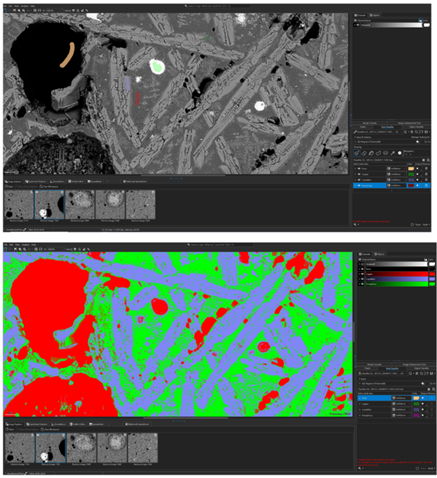
Aivia Classification- Training and AI-learning: Four to five images are uploaded for the training-learning process (classification). Manually marking grayscale color-patterns as different classifiers. These classifiers represent the different mineralogical phases in the slag. The main ones are pores, copper metal, crystalline, and amorphous.
5. Segmented Images in Batch Workflow
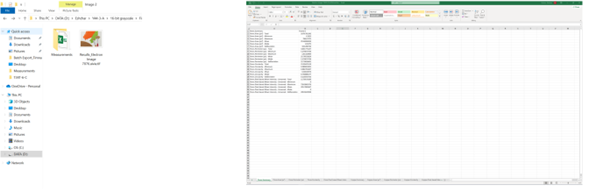
Once the software has been trained, all images are segmented. The process produces .tif files, which can be opened as an image on Aivia and Excel files with corresponding measurements of each segment (area, perimeter, circularity, std. deviation, etc.).
6. MatLab- Extracting Relevant Data
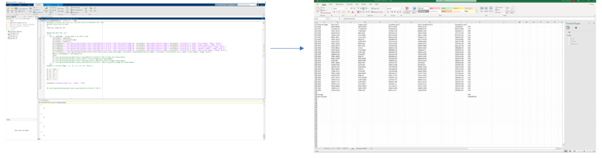
MatLab- The process produces Excel files with dozens of sheets. It is necessary to extract the relevant data using the coding tool MatLab and summarize it in one single Excel file.
Results
XRD- Percentage of the various crystalline minerals and the amorphous phase.
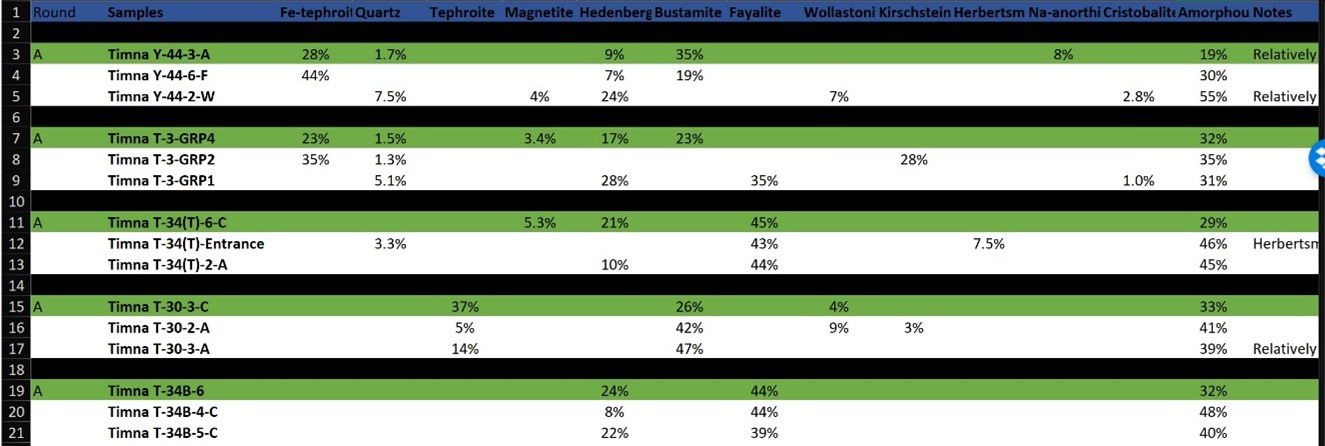
XRD- Percentage of the various crystalline minerals and the amorphous phase.
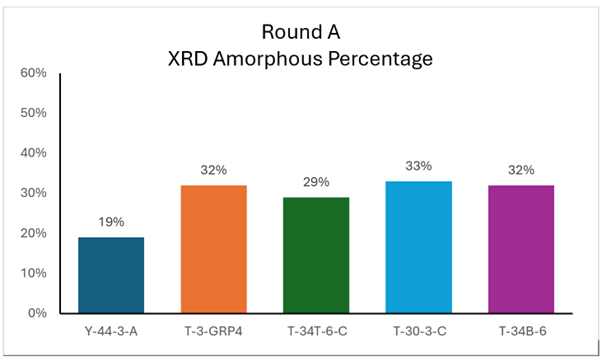
XRD Amorphous Percentage Graph
SEM image segmentation- Average proportion of amorphous phase in the slag samples to crystals, pores, copper metal, etc.
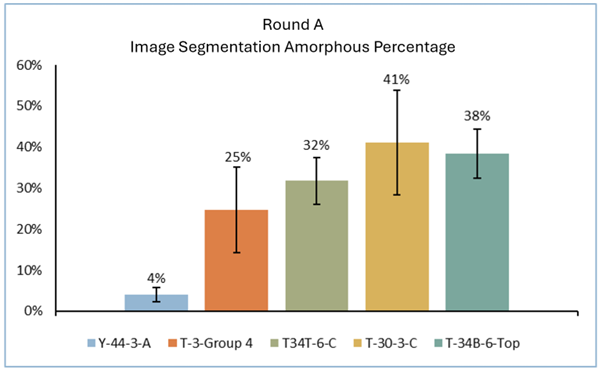
SEM image segmentation- Average proportion of amorphous phase in the slag samples to crystals, pores, copper metal, etc.
Challenges and Comments:
The XRD results have brought about very different crystallographic proportions from samples originating from the same site as well as several samples having a relatively poor fit to the calibrated database. The image segmentation is based on partial objectivity. While segmentation can estimate our interpretation of the glassy phase, as we identify it through greyscale patterns and EDS, it cannot be verified by any other means. The image segmentation is 2-dimensional and provides only a cross-section analysis. The XRD results of the Round A samples do not correlate with the SEM image segmentation results of Round A. • This is understandable since the porosity of the slag is irrelevant after the pulverising process, whereas it plays a considerable role in the segmentation. • It is possible to eliminate the proportion of the pores in the image segmentation and get a more relevant comparison between the results of the two methods.
Preliminary Conclusion of Round A
XRD: The XRD results are unclear and have produced inconsistent results. The high standard deviation between the three samples originating in the EB and the fact that the site produced the samples with the lowest (19%) and highest (55%) amorphous percentage, might stem from an error that occurred during the preparation of the sample, the procedure itself or from erroneous calibration. Furthermore, we expected the highest amorphous proportions in Mn-rich slag due to the high stability of Mn-oxide in comparison to Fe-oxide against fluctuations of temperature and oxygen partial pressure (Hauptmann 2006:1995). However, the Iron Age II Mn-rich samples from Site 30, where the most vitrification is expected, display a relatively low amorphous percentage in comparison to the Fe-rich samples from Early IA Site 34T and the Early Islamic Site 34B.
Segmentation: In the first round of segmentation, a general increase can be seen in the vitrification of slag. The greatest difference is between the technology originating from the Early Bronze Age and that of the Late Bronze Age, from 4% to 25%. From then on, a clear and distinct change in the general slag morphology and mineralogical composition is evident, but the amorphous phase increases only slightly. In site 30, the technological leap between the Early Iron Age and Iron Age II (10th century BCE), which infused the crushed ore with manganese flux rather than iron flux, the amorphous phase is higher. The technology from the Early Islamic period more than 1600 years later, did not use manganese flux and according to the segmentation results produced glass-rich slag but less glassy than its Mn-rich predecessor. As was already noted by Hauptmann (2006:1995), Fe-rich silicate facilitated crystallization and indeed, extremely large Fayalite crystals precipitated in the inner part of the slag body. However, it is difficult to draw any archaeological interpretations from only one round of samples from each site and any preliminary conclusion regarding the amorphous phase as a proxy for smelting technology and technological periods is still difficult to determine in light of the contradicting results of the XRD and image-segmentation.
Future Work
• Finish the other two rounds (B+C) for a complete image segmentation analysis of all 15 samples. • Spatially analyze differences in amorphous phase coverage between edges and the center. • After all the samples have been segmented, the results produced and the relevant data retrieved, we must begin analyzing their archaeological significance, observe if the results align with the research hypothesis and draw conclusions to the archaeological questions.